Original research · Data snapshot September 12, 2026
AI Product Manager Hiring Report 2026What 2,448 Job Postings Reveal About Skills, Salaries, Degrees & Experience
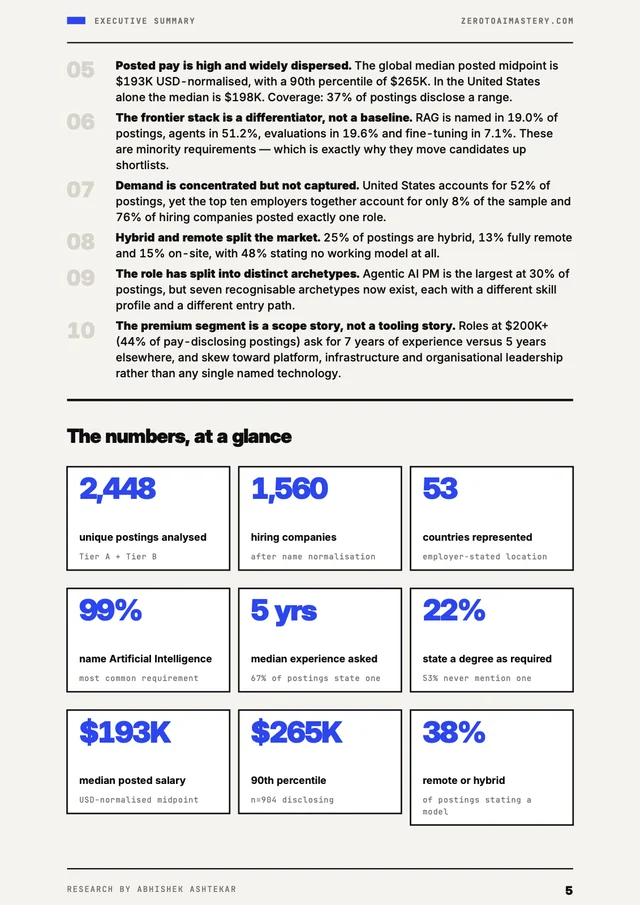
I pulled 8,073 AI product manager job postings from company hiring systems and job boards, linked 2,875 duplicates, and kept the 2,448 roles where AI is the actual job. Then I read what employers wrote down. This report is what they pay, what they screen for, and what they never ask for.

Abhishek AshtekarPublished · 45 min read
- North America57%
- Europe20%
- Asia-Pacific16%
- Rest of world8%
- AI postings scanned
- 8,073
- unique roles analyzed
- 2,448
- hiring companies
- 1,560
- countries
- 53
The 60-second version
10 findings that matter
Short on time? These ten findings carry the whole report. Each one links to the chapter with the charts and the detail behind it.
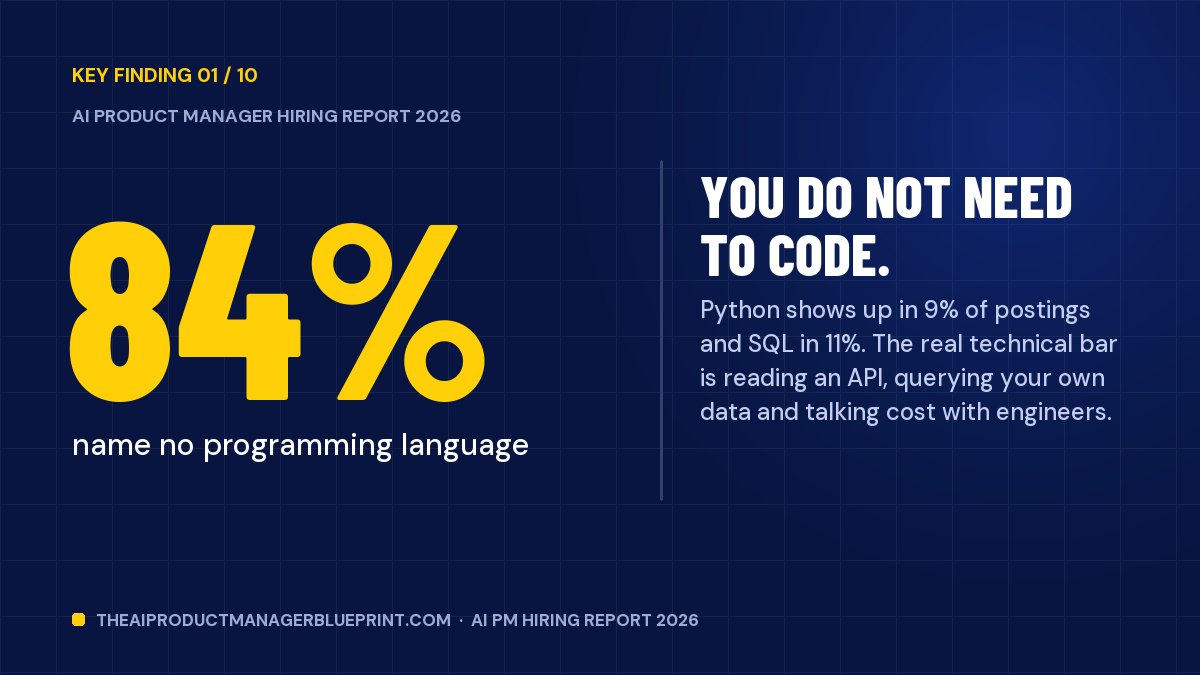
- 0184%name no programming language
You do not need to code.
Python shows up in 9% of postings and SQL in 11%. The real technical bar is reading an API, querying your own data and talking cost with engineers.
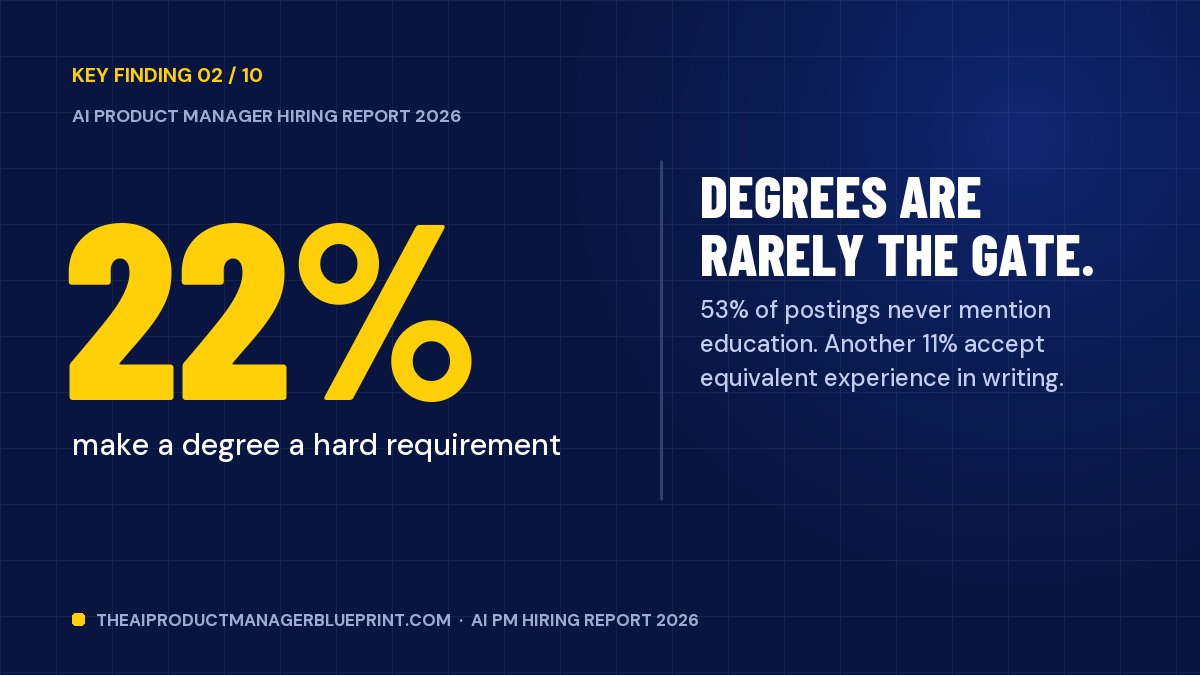
See the data - 0222%make a degree a hard requirement
Degrees are rarely the gate.
53% of postings never mention education. Another 11% accept equivalent experience in writing.
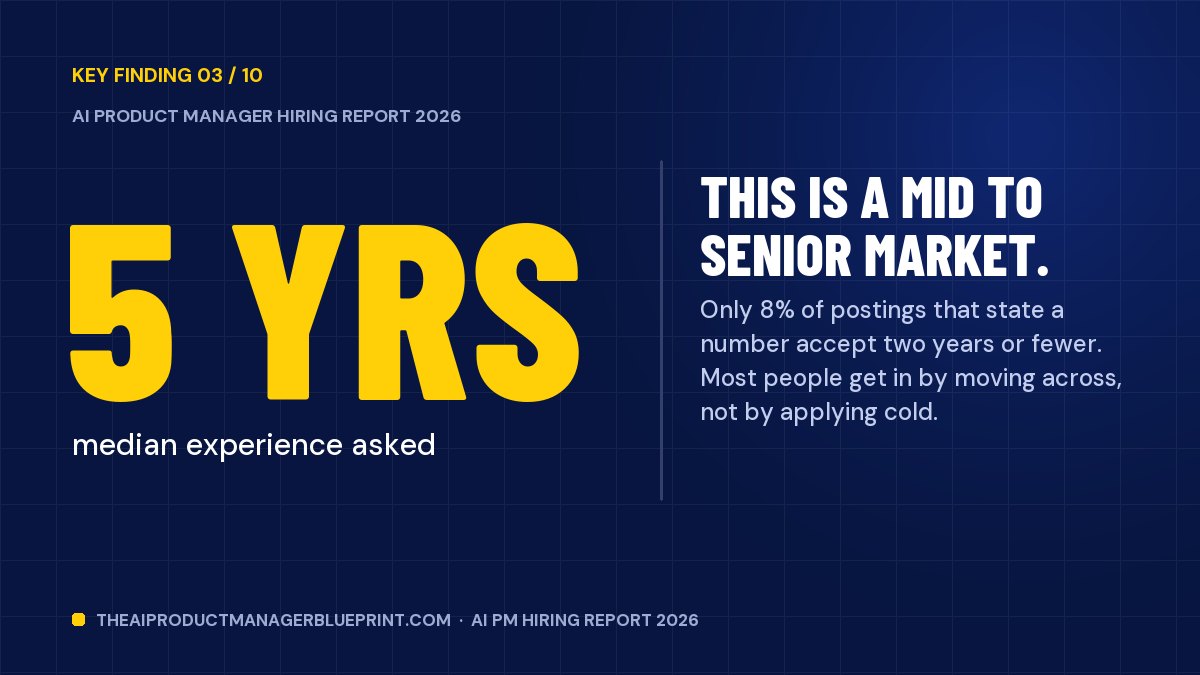
See the data - 035 yrsmedian experience asked
This is a mid to senior market.
Only 8% of postings that state a number accept two years or fewer. Most people get in by moving across, not by applying cold.
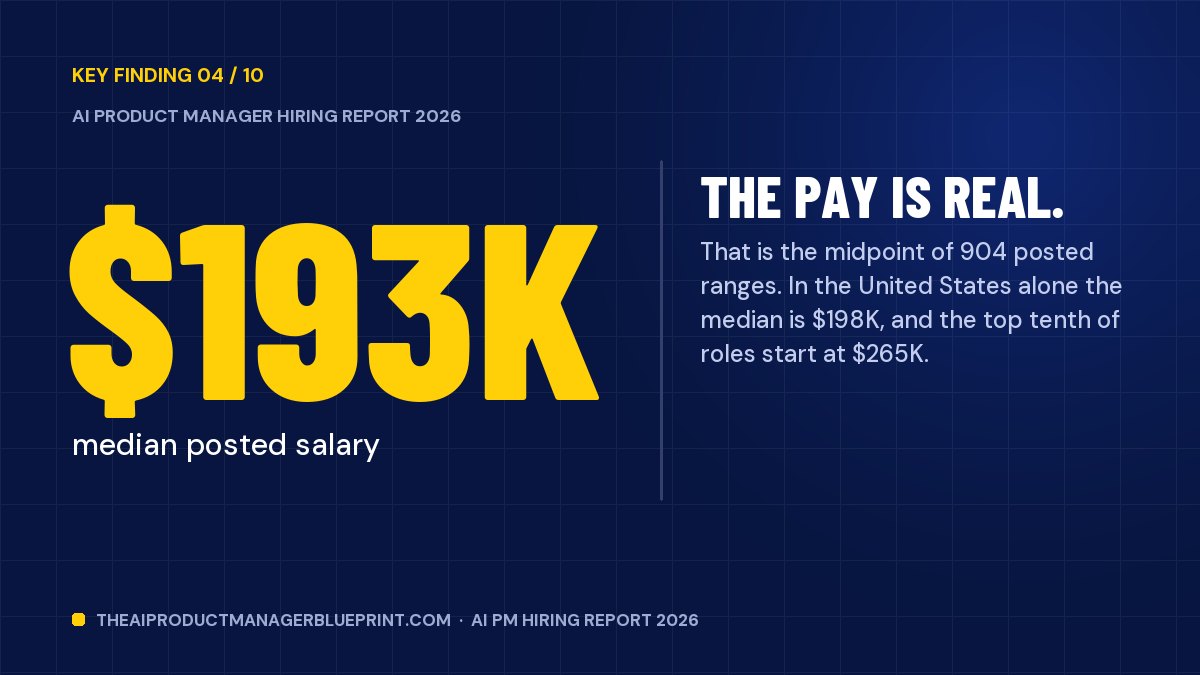
See the data - 04$193Kmedian posted salary
The pay is real.
That is the midpoint of 904 posted ranges. In the United States alone the median is $198K, and the top tenth of roles start at $265K.
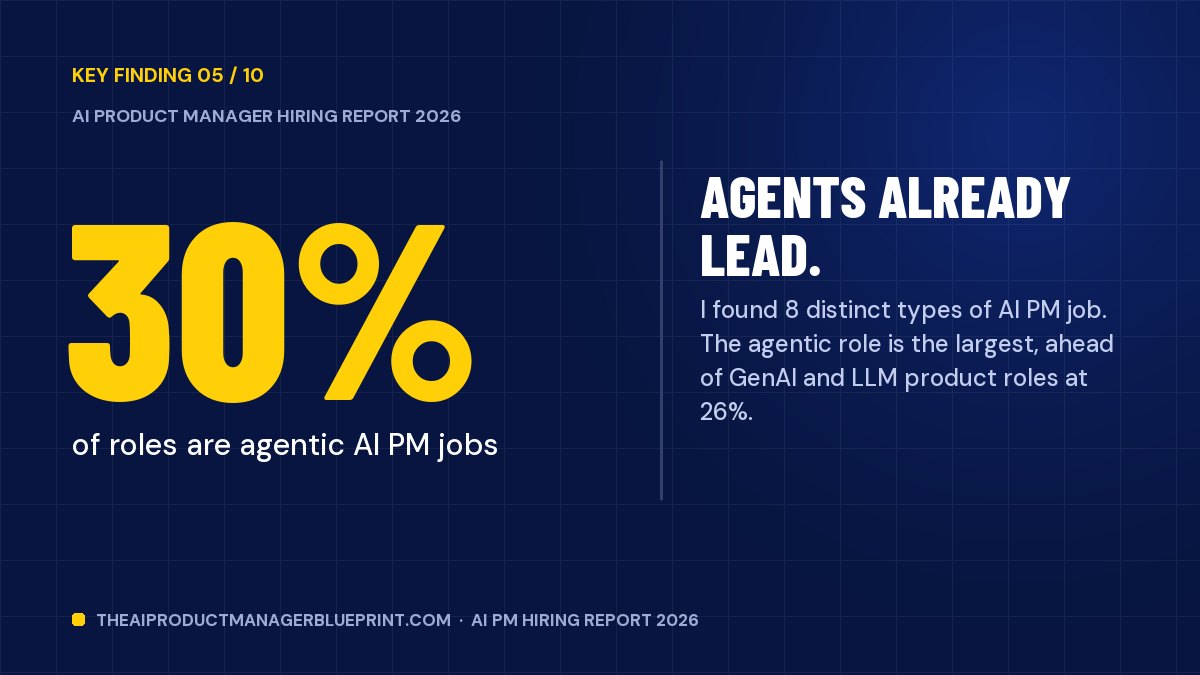
See the data - 0530%of roles are agentic AI PM jobs
Agents already lead.
I found 8 distinct types of AI PM job. The agentic role is the largest, ahead of GenAI and LLM product roles at 26%.
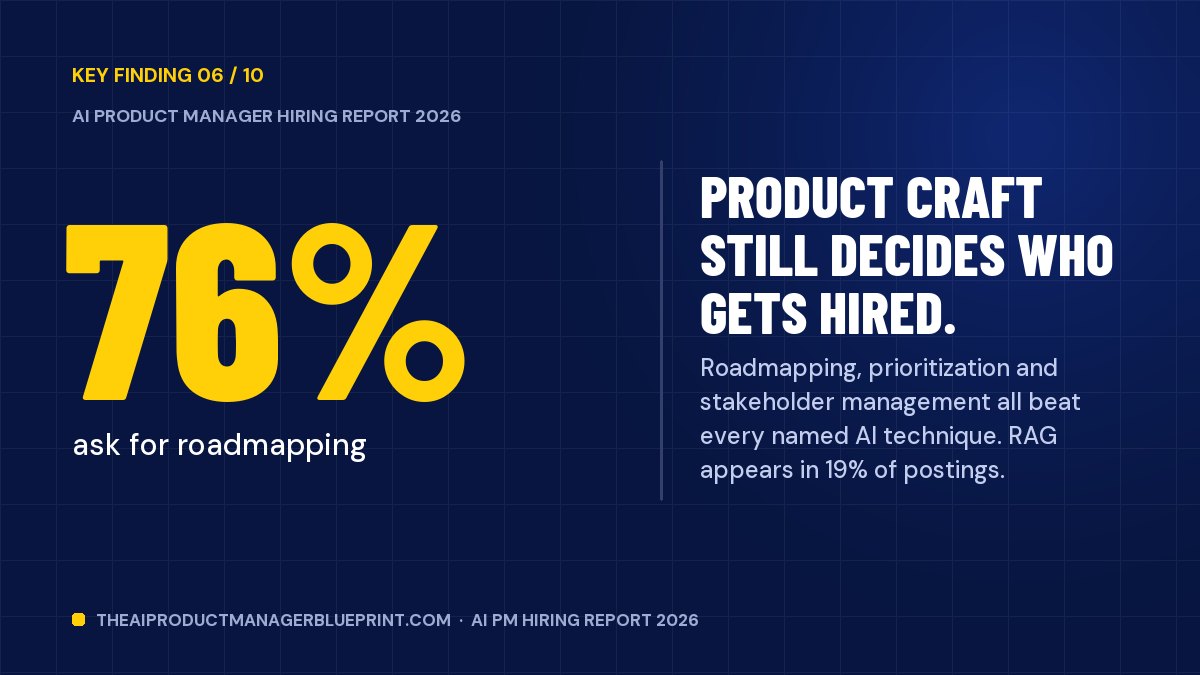
See the data - 0676%ask for roadmapping
Product craft still decides who gets hired.
Roadmapping, prioritization and stakeholder management all beat every named AI technique. RAG appears in 19% of postings.
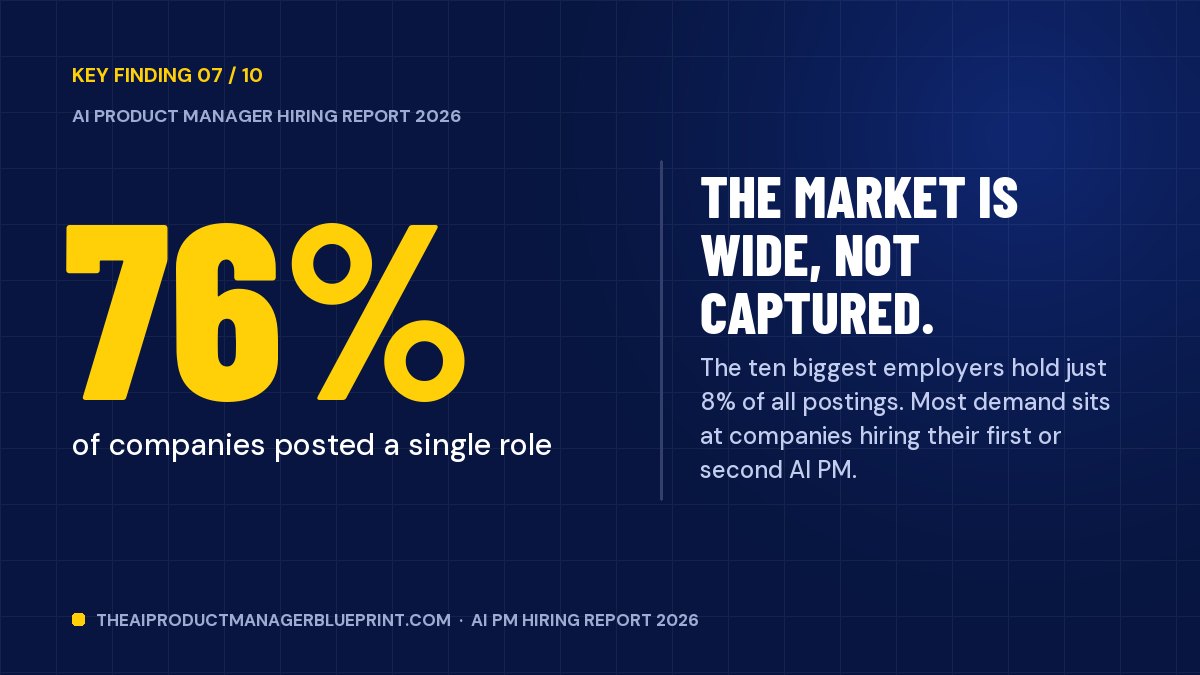
See the data - 0776%of companies posted a single role
The market is wide, not captured.
The ten biggest employers hold just 8% of all postings. Most demand sits at companies hiring their first or second AI PM.
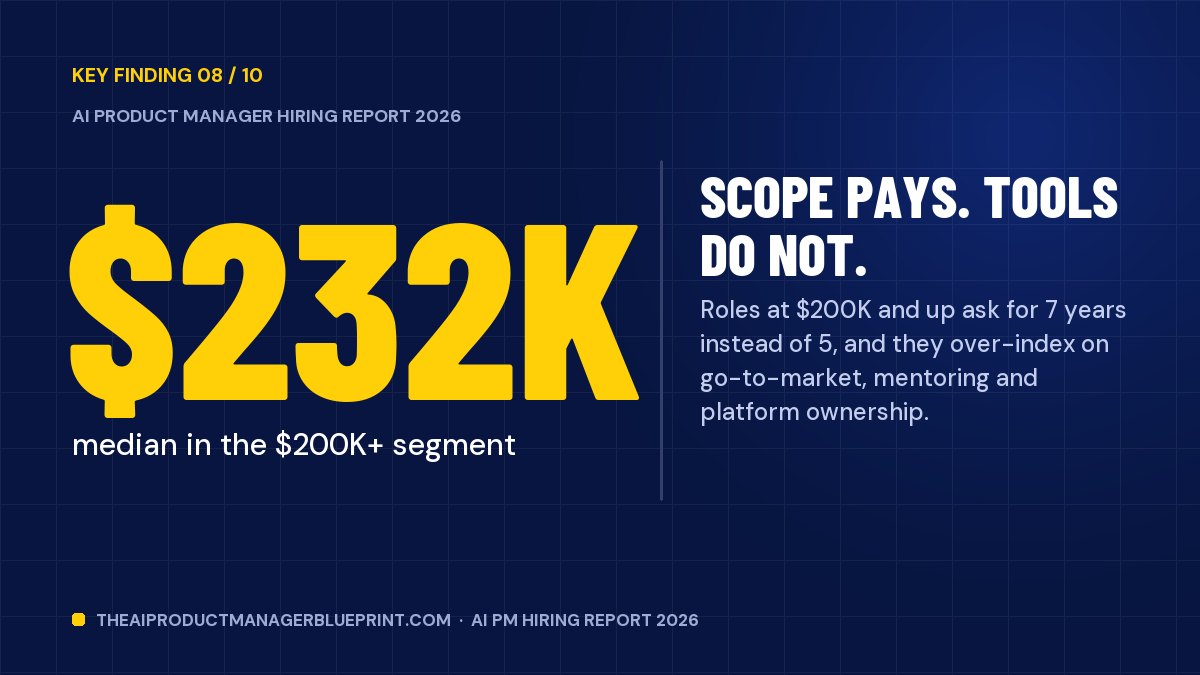
See the data - 08$232Kmedian in the $200K+ segment
Scope pays. Tools do not.
Roles at $200K and up ask for 7 years instead of 5, and they over-index on go-to-market, on mentoring and on owning a platform.
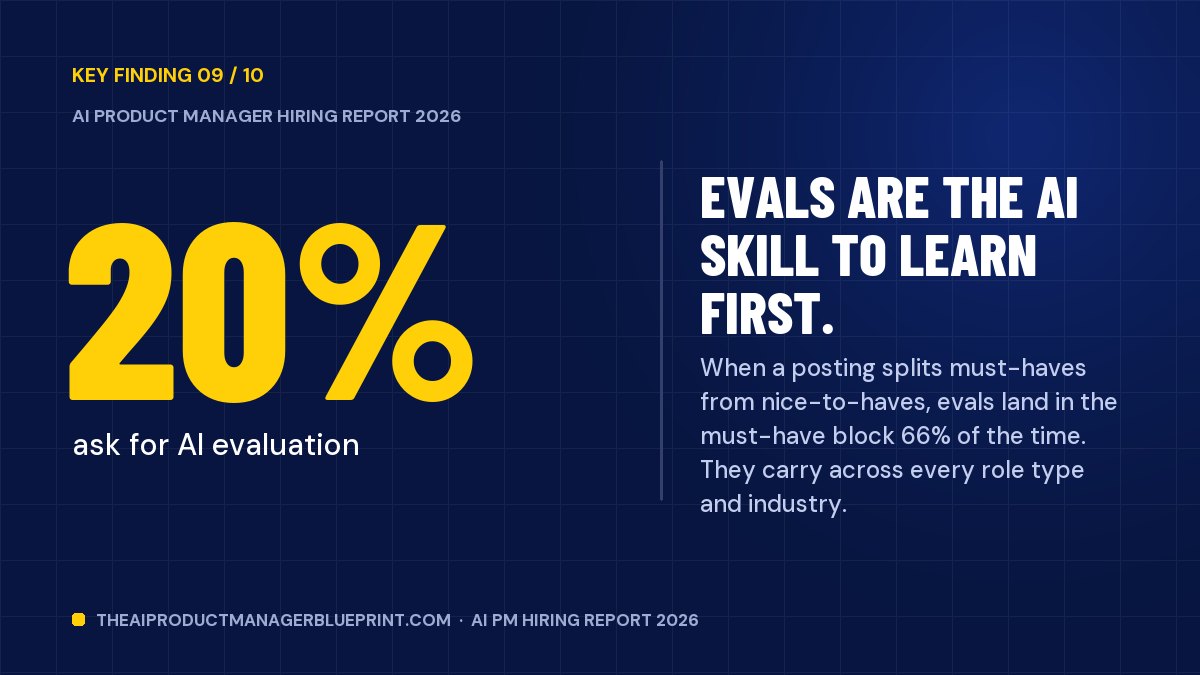
See the data - 0920%ask for AI evaluation
Evals are the AI skill to learn first.
When a posting splits must-haves from nice-to-haves, evals land in the must-have block 66% of the time. They carry across every role type and industry.
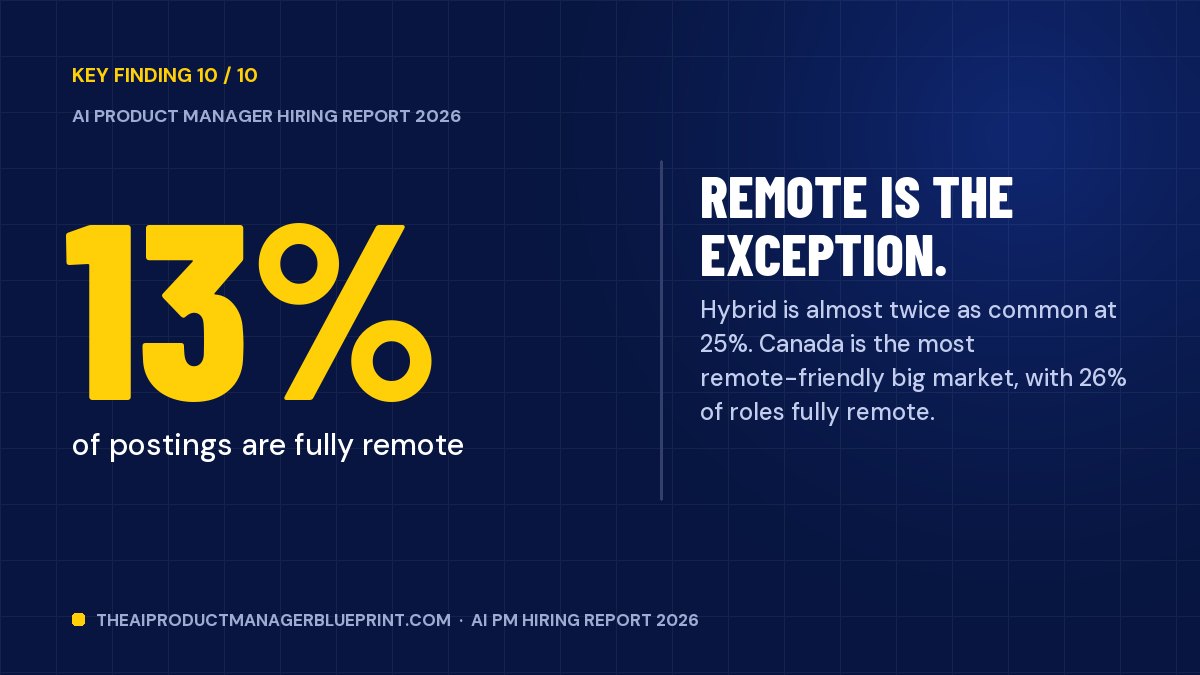
See the data - 1013%of postings are fully remote
Remote is the exception.
Hybrid is almost twice as common at 25%. Canada is the most remote-friendly big market, with 26% of roles fully remote.
See the data
How I built this dataset
Most salary and skills articles quote someone else’s survey. This one starts from the job postings themselves, collected at the source and de-duplicated by hand-written rules.
Before a single chart, you should know exactly what you are looking at. Here is the pipeline, in plain English.
Where the postings came from
Wherever I could, I pulled postings straight from the applicant tracking systems employers use to publish roles: Greenhouse, Lever, Ashby, Workday, SmartRecruiters and others. Those records carry the requisition ID, the posting date and, often, a structured salary field that job aggregators strip out. Where a company’s own board was not reachable, I used public job platform listings, mainly LinkedIn’s public job search.
Where the unique postings came from
Source of the record kept after de-duplication. Employer systems were preferred whenever the same role appeared in several places.
The data behind this chart
| Source | Postings | Share |
|---|---|---|
| LinkedIn public jobs | 1,816 | 74.2% |
| Greenhouse boards | 244 | 10.0% |
| Ashby boards | 185 | 7.6% |
| Lever boards | 71 | 2.9% |
| Workday career sites | 59 | 2.4% |
| The Muse | 48 | 2.0% |
| SmartRecruiters | 14 | 0.6% |
| Himalayas | 9 | 0.4% |
| jobicy | 1 | 0.0% |
| arbeitnow | 1 | 0.0% |
Source: AI Product Manager Hiring Report 2026, analysis of 2,448 unique AI PM postings captured September 12, 2026.
How duplicates were removed
One job can appear on a company careers page, two tracking system mirrors and five job boards. Count each copy and every percentage in this report would be wrong. So I ran six matching passes in order: identical URLs, identical descriptions within a company, identical descriptions across sources, identical requisition IDs, and two near-duplicate checks that compare the title, the location and the description text. Each pass links a copy to the record already kept instead of deleting it blindly.
That process removed 2,875 duplicate records, or 36% of everything collected. It is the single biggest difference between this report and a keyword count on a job board.
From 8,073 postings to 2,448
Each stage of the pipeline, in postings.
The data behind this chart
| Stage | Postings |
|---|---|
| AI-relevant postings collected | 8,073 |
| Unique after removing duplicates | 5,198 |
| AI central to the role (Tier A + B) | 2,448 |
| AI in the job title (Tier A) | 1,784 |
Source: AI Product Manager Hiring Report 2026, analysis of 2,448 unique AI PM postings captured September 12, 2026.
What counts as an AI product manager job
A title filter kept product management roles (product manager, product owner, group PM, head, director and VP of product) and threw out adjacent jobs that share the vocabulary: product marketing, product design, program management, analytics and engineering. Then every remaining posting was scored on how central AI is to the role itself.
- Tier A (1,784 postings). AI, ML, GenAI, LLM or an equivalent term is in the job title.
- Tier B (664 postings). A general PM title, but the responsibilities and requirements make AI the core of the job.
- Tier C (2,750 postings). AI is present but not central. Kept for checks, excluded from every number on this page.
The scoring reads the role section of each description, not the company boilerplate. A lot of employers now open every job ad with “we are an AI-first company”. Scoring the whole document would turn their ordinary PM roles into AI roles and inflate the market.
Two rules for reading every number
First, every percentage is a share of the 2,448 postings unless a chart says otherwise. When a field is only partly stated, like salary or experience, the base is the postings that state it, and I show you that count.
Second, salaries are what employers advertised, not what people accepted. They are mostly base pay ranges, and I use the midpoint of each range. Bonus and equity are not in them. That is why self-reported pay sites run higher, and it is why you should read the money chapter as the floor of a real offer, not the ceiling.
The full method, the limits of the data and a stricter Tier A only check are at the end of this page and in the PDF.
Where the AI PM jobs are
The United States holds half the market. The other half is spread across 53 countries, and a handful of cities do most of the hiring.
The United States posted 1,283 of the 2,448 roles. That share is partly real demand and partly transparency: US employers publish more roles on public systems, and state pay laws make them publish salaries too.
The next tier is India, the United Kingdom, Canada and Germany. Together those four add 21% of the market. After that it becomes a long tail. 25 countries recorded at least ten unique postings.
AI product manager postings by country
Top 12 of 53 countries, share of all 2,448 postings.
The data behind this chart
| Country | Postings | Share |
|---|---|---|
| United States | 1,283 | 52.4% |
| India | 181 | 7.4% |
| United Kingdom | 133 | 5.4% |
| Canada | 104 | 4.2% |
| Germany | 93 | 3.8% |
| France | 59 | 2.4% |
| Singapore | 58 | 2.4% |
| Israel | 47 | 1.9% |
| Spain | 42 | 1.7% |
| Netherlands | 22 | 0.9% |
| Mainland China | 20 | 0.8% |
| Australia | 20 | 0.8% |
| Poland | 20 | 0.8% |
| Portugal | 19 | 0.8% |
| Ireland | 19 | 0.8% |
| United Arab Emirates | 16 | 0.7% |
| Brazil | 15 | 0.6% |
| Malaysia | 14 | 0.6% |
| Belgium | 14 | 0.6% |
| Romania | 13 | 0.5% |
| Vietnam | 13 | 0.5% |
| South Korea | 13 | 0.5% |
| Japan | 13 | 0.5% |
| Hong Kong | 12 | 0.5% |
| Philippines | 11 | 0.4% |
| Mexico | 9 | 0.4% |
| Taiwan | 9 | 0.4% |
| Switzerland | 9 | 0.4% |
| Greece | 8 | 0.3% |
| New Zealand | 8 | 0.3% |
| Indonesia | 8 | 0.3% |
| South Africa | 7 | 0.3% |
| Colombia | 6 | 0.2% |
| Thailand | 6 | 0.2% |
| Italy | 6 | 0.2% |
| Sweden | 5 | 0.2% |
| Czechia | 5 | 0.2% |
| Bulgaria | 5 | 0.2% |
| Denmark | 5 | 0.2% |
| Saudi Arabia | 4 | 0.2% |
Source: AI Product Manager Hiring Report 2026, analysis of 2,448 unique AI PM postings captured September 12, 2026.
The regional split
North America takes 57% of postings, Europe 20% and Asia-Pacific 16%. The Middle East, Africa and Latin America together are under 5%, and English-language collection undercounts them, which I cover in the limits section.
Share of postings by region
- North America
- Europe
- Asia-Pacific
- Middle East, Africa & Latin America
The data behind this chart
| Region | Postings | Share |
|---|---|---|
| North America | 1,387 | 56.7% |
| Europe | 491 | 20.1% |
| Asia-Pacific | 386 | 15.8% |
| Middle East & Africa | 82 | 3.3% |
| Latin America | 32 | 1.3% |
| Other/Unspecified | 4 | 0.2% |
Source: AI Product Manager Hiring Report 2026, analysis of 2,448 unique AI PM postings captured September 12, 2026.
The cities that hire
Cities are more concentrated than countries. San Francisco alone carries 6.7% of every AI PM posting on earth. Add San Jose, New York, Bengaluru and London and five cities hold 24.2% of the market.
The 12 cities posting the most AI PM roles
Share of all postings. Remote roles with no home city are not counted.
Highlighted: the five cities that together hold 24.2% of the market.
The data behind this chart
| City | Postings | Share |
|---|---|---|
| San Francisco | 165 | 6.7% |
| San Jose | 136 | 5.6% |
| New York | 135 | 5.5% |
| Bengaluru | 79 | 3.2% |
| London | 78 | 3.2% |
| Seattle | 76 | 3.1% |
| Singapore | 57 | 2.3% |
| Toronto | 48 | 2.0% |
| Boston | 46 | 1.9% |
| Austin | 38 | 1.6% |
| Paris | 38 | 1.6% |
| Tel Aviv | 37 | 1.5% |
| Chicago | 33 | 1.3% |
| Washington DC | 27 | 1.1% |
| Berlin | 26 | 1.1% |
| Barcelona | 26 | 1.1% |
| Delhi NCR | 24 | 1.0% |
| Atlanta | 23 | 0.9% |
| Hyderabad | 20 | 0.8% |
| Sydney | 20 | 0.8% |
| Mumbai | 20 | 0.8% |
| San Diego | 19 | 0.8% |
| Vancouver | 18 | 0.7% |
| Charlotte | 18 | 0.7% |
| Munich | 15 | 0.6% |
| Amsterdam | 13 | 0.5% |
| Kuala Lumpur | 13 | 0.5% |
| Hong Kong | 13 | 0.5% |
| Dallas | 13 | 0.5% |
| Denver | 12 | 0.5% |
Source: AI Product Manager Hiring Report 2026, analysis of 2,448 unique AI PM postings captured September 12, 2026.
Those counts only include postings anchored to a city, so fully remote roles with no home base do not appear here. Bengaluru at number four is worth noticing. India is the second biggest country in this dataset, and Bengaluru alone accounts for 79 of its 181 postings.
Who is hiring AI product managers
Not a few AI labs. 1,560 different companies, most of them hiring one person.
This is the finding I did not expect. Before I ran the numbers I assumed a small group of big tech companies and AI labs would dominate. They do not. The ten employers with the most postings account for 8% of the market. The other 92% is spread across more than fifteen hundred companies.
That changes how you should search. If your list starts and ends with Google, Meta and OpenAI, you are fighting the biggest crowd for the smallest slice. The larger opportunity sits with the bank, the insurer, the healthcare software company or the logistics firm hiring its first AI product manager. Fewer applicants, broader scope, and a brief you get to shape.
Employers with the most unique AI PM postings
After de-duplicating syndicated copies of the same role.
The data behind this chart
| Employer | Postings | Median posted pay | Industry | Countries |
|---|---|---|---|---|
| Amazon | 32 | $196K | E-commerce & Retail | 4 |
| JPMorgan Chase | 24 | Not enough disclosed | Financial Services & FinTech | 3 |
| 24 | Not enough disclosed | Big Tech & Consumer Internet | 3 | |
| Airwallex | 17 | $230K | Financial Services & FinTech | 4 |
| Veeva | 16 | $125K | Healthcare & Life Sciences | 4 |
| Palo Alto Networks | 16 | $215K | Cybersecurity | 2 |
| Microsoft | 15 | $209K | Big Tech & Consumer Internet | 2 |
| Amazon Web Services (AWS) | 14 | $213K | Enterprise Software & SaaS | 1 |
| OKX | 13 | Not enough disclosed | Financial Services & FinTech | 3 |
| Capital One | 13 | $176K | Financial Services & FinTech | 1 |
| Veeva Systems | 13 | $125K | Healthcare & Life Sciences | 3 |
| TikTok | 13 | Not enough disclosed | Big Tech & Consumer Internet | 2 |
| ServiceNow | 12 | $304K | Enterprise Software & SaaS | 2 |
| Meta | 12 | Not enough disclosed | Big Tech & Consumer Internet | 3 |
| Qualcomm | 11 | $245K | Manufacturing & Industrial | 1 |
| Adobe | 11 | $238K | Enterprise Software & SaaS | 1 |
| Intuit | 11 | $242K | Financial Services & FinTech | 1 |
| BNY | 11 | Not enough disclosed | Financial Services & FinTech | 2 |
| Citi | 11 | $228K | Financial Services & FinTech | 4 |
| Walmart | 11 | $165K | E-commerce & Retail | 1 |
| NVIDIA | 11 | Not enough disclosed | Manufacturing & Industrial | 1 |
| Scale AI | 10 | $231K | AI / ML Native | 3 |
| Red Ventures | 9 | $188K | Telecom & Networking | 1 |
| Deloitte | 9 | $173K | Consulting & Professional Services | 5 |
| Wolters Kluwer | 9 | $163K | Healthcare & Life Sciences | 4 |
| Binance | 8 | Not enough disclosed | Financial Services & FinTech | 4 |
| EY | 8 | Not enough disclosed | Consulting & Professional Services | 5 |
| Bloomberg | 8 | $218K | Developer Tools & Infrastructure | 2 |
| Uber | 8 | Not enough disclosed | Automotive & Mobility | 2 |
| Shopee | 8 | Not enough disclosed | E-commerce & Retail | 3 |
| Workday | 7 | Not enough disclosed | Enterprise Software & SaaS | 3 |
| LSEG | 7 | Not enough disclosed | Developer Tools & Infrastructure | 3 |
| Lenovo | 7 | Not enough disclosed | Enterprise Software & SaaS | 3 |
| Bloomreach | 6 | Not enough disclosed | Enterprise Software & SaaS | 3 |
| Snowflake | 6 | $244K | Developer Tools & Infrastructure | 2 |
Source: AI Product Manager Hiring Report 2026, analysis of 2,448 unique AI PM postings captured September 12, 2026. Median pay shown where at least five postings disclose a range.
Amazon leads with 32 unique postings, then JPMorgan Chase and Google with 24 each. Two financial companies in the top five tells you where the budget is. Where at least five of an employer’s postings list pay, the data table includes the median. ServiceNow posts the highest of the group at $304K.
How to find the companies hiring their first AI PM
These companies rarely show up when you search for famous names, so search for the work instead. Look for postings that mention a new AI product line, a first AI hire or a team being built. Follow the product and engineering leaders at mid-size companies in your industry, because they announce these roles before recruiters do. Check the careers pages of companies that just announced an AI feature, since someone now has to own it. And when you find one, write to the hiring manager directly with a short note on the first problem you would solve. A first AI PM hire is a bet on judgment, and a specific note shows yours.
Which industries are buying
Enterprise software leads at 18.4% of postings. Financial services is right behind at 17.0%, and healthcare is third at 8.0%. AI product management has already left the tech industry.
AI PM postings by employer industry
Share of all postings. 20.1% could not be assigned an industry and are not shown.
The data behind this chart
| Industry | Postings | Share |
|---|---|---|
| Other / Unclassified | 491 | 20.1% |
| Enterprise Software & SaaS | 450 | 18.4% |
| Financial Services & FinTech | 417 | 17.0% |
| Healthcare & Life Sciences | 197 | 8.0% |
| Developer Tools & Infrastructure | 149 | 6.1% |
| E-commerce & Retail | 97 | 4.0% |
| Big Tech & Consumer Internet | 97 | 4.0% |
| Cybersecurity | 91 | 3.7% |
| Manufacturing & Industrial | 72 | 2.9% |
| AI / ML Native | 60 | 2.5% |
| Consulting & Professional Services | 52 | 2.1% |
| Media, Gaming & Entertainment | 51 | 2.1% |
| Public Sector & Defense | 37 | 1.5% |
| Telecom & Networking | 33 | 1.3% |
| Automotive & Mobility | 32 | 1.3% |
| Travel & Hospitality | 27 | 1.1% |
| Real Estate & PropTech | 24 | 1.0% |
| Energy, Climate & Utilities | 22 | 0.9% |
| Education & EdTech | 21 | 0.9% |
| HR Tech & Future of Work | 18 | 0.7% |
| Logistics & Supply Chain | 10 | 0.4% |
Source: AI Product Manager Hiring Report 2026, analysis of 2,448 unique AI PM postings captured September 12, 2026.
The industry you target changes what the job asks for. Financial services and healthcare postings ask for governance, model risk and audit language far above average. Developer tools postings are the most technical in the dataset, heavy on APIs and system design. AI-native companies, only 2.5% of postings, write the loosest briefs and expect the most independent judgment.
What each industry screens for
- Enterprise software. The fastest to adopt AI PM titles. These postings screen hardest on product fundamentals and go-to-market, because the AI feature has to sell into an existing customer base.
- Financial services. Governance, model risk and audit language run far above the rest of the dataset. If you cannot explain how a model decision gets reviewed, you will not get past the second interview.
- Healthcare. Regulatory literacy and human review show up again and again. Knowing a clinical or claims workflow is often the deciding factor.
- Developer tools. The most technical postings in the data. Expect API design, system design and developer experience to be tested directly.
- Retail and e-commerce. Ranking, personalization and merchandising. Classic machine learning still sits at the center, next to the generative work.
- Cybersecurity. Detection quality and the cost of false positives come up more than generative AI does. Evaluation skills carry real weight here.
Read the industry before you read the title. Two postings called “Senior AI Product Manager” at a bank and at a developer tools company are close to different jobs, and they reward different stories in the interview.
What an AI product manager actually is
There is no single AI PM job. There are 8 of them, and picking yours early decides which skills matter.
Employers used 1,808 distinct titles across 2,448 postings. That sounds chaotic, but the most common titles are the plainest ones. “AI Product Manager” leads with 103 postings. Exotic titles like AI evangelist or agent architect barely register in product hiring.
73% of postings put AI, ML or GenAI right in the title. The other 27% are ordinary product manager titles where the description makes AI the core of the work. If you only search for “AI product manager”, you miss roughly one role in four.
The most common job titles, exactly as posted
1,808 distinct titles in total.
The data behind this chart
| Title | Postings | Share |
|---|---|---|
| AI Product Manager | 103 | 4.2% |
| Senior Product Manager | 50 | 2.0% |
| Product Manager | 39 | 1.6% |
| AI Product Owner | 37 | 1.5% |
| Senior AI Product Manager | 31 | 1.3% |
| Senior Product Manager, AI | 17 | 0.7% |
| AI Product Lead | 16 | 0.7% |
| Principal Product Manager | 13 | 0.5% |
| Product Manager, AI | 12 | 0.5% |
| Senior Product Manager - AI | 11 | 0.4% |
| Staff Product Manager | 9 | 0.4% |
| Technical Product Manager | 9 | 0.4% |
| Product Manager - AI | 9 | 0.4% |
| Principal Product Manager, AI | 6 | 0.2% |
| Lead AI Product Manager | 6 | 0.2% |
| Staff Product Manager, Developer Experience | 5 | 0.2% |
| Product Manager - AI Platform | 5 | 0.2% |
| Technical Product Manager - Veeva Labeling AI | 5 | 0.2% |
| Principal Product Manager - AI | 5 | 0.2% |
| Senior Product Manager - AI Agent | 5 | 0.2% |
| Data & AI Product Manager | 5 | 0.2% |
| GenAI Product Lead, EMAP | 5 | 0.2% |
| Lead Product Manager | 4 | 0.2% |
| Technical Product Manager - AI | 4 | 0.2% |
| Senior Product Manager, AI Platform | 4 | 0.2% |
| Principal Product Manager, AI Platform | 4 | 0.2% |
| Technical Product Manager (AI) - Vault Medical | 4 | 0.2% |
| Technical Product Manager (AI) - Veeva Quality Cloud | 4 | 0.2% |
| Technical Product Manager (AI) - Veeva QualityDocs & Training | 4 | 0.2% |
| Associate Product Manager | 4 | 0.2% |
Source: AI Product Manager Hiring Report 2026, analysis of 2,448 unique AI PM postings captured September 12, 2026.
Seniority: the middle of the ladder
Mid-level roles are the biggest block at 41%. Senior and above add up to 58%. Entry and associate titles are 1.5% of the market. That is the clearest single number on how hard this field is to enter directly, and chapter 5 shows what to do about it.
Seniority of AI PM postings
Level parsed from the job title.
Entry and associate roles: 1.5% of the market.
The data behind this chart
| Level | Postings | Share |
|---|---|---|
| Entry / Associate | 37 | 1.5% |
| Mid-level | 1,002 | 40.9% |
| Senior | 648 | 26.5% |
| Lead / Group PM | 191 | 7.8% |
| Principal / Distinguished | 344 | 14.1% |
| Executive (VP/Head/Director) | 226 | 9.2% |
Source: AI Product Manager Hiring Report 2026, analysis of 2,448 unique AI PM postings captured September 12, 2026.
The eight types of AI product manager
I grouped every posting by what the role owns, using its title and responsibility language. Eight types came out. They differ in what they build, who they work with and what they screen for. Pick one and tap through to see its share of the market, its pay and its most requested skills.
The eight types of AI product manager
Tap a type. Bars in the tabs show its share of all postings.
Agentic AI PM
Owns workflows where software acts on a user’s behalf.
- Share of postings
- 30.4%
- Postings
- 744
- Median posted pay
- $195K
- Median experience
- 5 yrs
- Degree required
- 18.5%
What it screens for
Tool use design, permissions, failure recovery, and what the system may do unsupervised.
Easiest way in
Anyone who has designed a workflow that can fail safely.
Pay based on 328 postings that disclose a range.
Most requested skills in this role type
GenAI / LLM Product PM
Owns user-facing products built on foundation models.
- Share of postings
- 25.9%
- Postings
- 635
- Median posted pay
- $185K
- Median experience
- 5 yrs
- Degree required
- 20.8%
What it screens for
Prompt and context design, evaluation discipline, latency and cost trade-offs.
Easiest way in
Consumer and B2B SaaS PMs. Close the evals gap.
Pay based on 216 postings that disclose a range.
Most requested skills in this role type
Data / ML Product PM
Owns ranking, recommendations, forecasting and personalization.
- Share of postings
- 13.3%
- Postings
- 326
- Median posted pay
- $195K
- Median experience
- 5 yrs
- Degree required
- 28.8%
What it screens for
Metrics rigor, experimentation and a working grasp of data pipelines.
Easiest way in
Analysts, data scientists and classic ML product people.
Pay based on 119 postings that disclose a range.
Most requested skills in this role type
AI Platform / Infra PM
Owns the internal AI platform other teams build on.
- Share of postings
- 8.5%
- Postings
- 208
- Median posted pay
- $204K
- Median experience
- 5 yrs
- Degree required
- 23.6%
What it screens for
Systems thinking, inference cost, model serving and developer empathy.
Easiest way in
Technical PMs and engineers moving into product.
Pay based on 86 postings that disclose a range.
Most requested skills in this role type
General AI Product Manager
Broad AI ownership, often the company’s first AI PM.
- Share of postings
- 8.0%
- Postings
- 197
- Median posted pay
- $194K
- Median experience
- 5 yrs
- Degree required
- 19.8%
What it screens for
Range, and comfort with a brief nobody has written yet.
Easiest way in
Generalist PMs who like shaping something new.
Pay based on 44 postings that disclose a range.
Most requested skills in this role type
Applied AI / AI Applications PM
Adds AI to an existing product surface.
- Share of postings
- 7.6%
- Postings
- 187
- Median posted pay
- $175K
- Median experience
- 5 yrs
- Degree required
- 25.7%
What it screens for
Prioritization and change management as much as AI depth.
Easiest way in
The most common internal move for existing PMs.
Pay based on 63 postings that disclose a range.
Most requested skills in this role type
Conversational AI PM
Owns assistants, copilots and the automation behind support.
- Share of postings
- 3.5%
- Postings
- 85
- Median posted pay
- $187K
- Median experience
- 5 yrs
- Degree required
- 18.8%
What it screens for
Dialogue design, containment metrics and the handoff to a human.
Easiest way in
Support, CX and service design people, as well as PMs.
Pay based on 31 postings that disclose a range.
Most requested skills in this role type
Responsible AI / Governance PM
Owns policy, safety, evaluation standards and regulatory readiness.
- Share of postings
- 2.7%
- Postings
- 66
- Median posted pay
- $178K
- Median experience
- 5 yrs
- Degree required
- 22.7%
What it screens for
Governance frameworks, risk language and cross-functional authority.
Easiest way in
Risk, compliance, policy and legal people with product exposure.
Pay based on 17 postings that disclose a range.
Most requested skills in this role type
The data behind this chart
| Role type | Share | Postings | Median posted pay | Median experience | Degree required |
|---|---|---|---|---|---|
| Agentic AI PM | 30.4% | 744 | $195K | 5 yrs | 18.5% |
| GenAI / LLM Product PM | 25.9% | 635 | $185K | 5 yrs | 20.8% |
| Data / ML Product PM | 13.3% | 326 | $195K | 5 yrs | 28.8% |
| AI Platform / Infra PM | 8.5% | 208 | $204K | 5 yrs | 23.6% |
| General AI Product Manager | 8.0% | 197 | $194K | 5 yrs | 19.8% |
| Applied AI / AI Applications PM | 7.6% | 187 | $175K | 5 yrs | 25.7% |
| Conversational AI PM | 3.5% | 85 | $187K | 5 yrs | 18.8% |
| Responsible AI / Governance PM | 2.7% | 66 | $178K | 5 yrs | 22.7% |
Source: AI Product Manager Hiring Report 2026, analysis of 2,448 unique AI PM postings captured September 12, 2026.
Agentic AI PM is the largest type at 30.4%. These roles own workflows where software acts on a user’s behalf, so they screen for tool use design, permissions, failure recovery and the question every agent team argues about: what is the system allowed to do without asking?
GenAI and LLM product roles are next at 25.9%. They own user-facing products built on foundation models and screen for prompt and context design, evaluation discipline, latency and cost. Data and ML product roles, the oldest type, own ranking, recommendations and the forecasts at 13.3%. AI platform roles pay the most of the eight, with a median of $204K, because they own the internal systems other teams build on.
The smaller types are just as distinct. General AI PM roles, 8.0% of postings, usually mean the company is hiring its first AI product manager and wants range more than depth. Applied AI roles, 7.6%, add AI to a product that already exists, so they screen for prioritization and change management as much as for model knowledge. Conversational AI roles, 3.5%, own assistants and support automation and live on containment and handoff metrics. Responsible AI and governance roles, 2.7%, own policy and safety work, plus readiness for regulators, and 88% of them name responsible AI directly.
How the job differs from regular product management
The postings point to four real differences. The first is uncertainty. A regular PM ships a feature that behaves the same way every time. An AI PM ships a capability that behaves differently every time and has to define “good enough” before launch. That is why evaluation language appears in postings that name no other technical term.
Second, quality becomes part of the product. Guardrails, hallucination handling and human review appear as product requirements, not engineering footnotes. Third, cost and latency land on the roadmap, because every model call has a price. Fourth, the room gets bigger. AI PM postings name applied scientists, ML engineers, legal and risk teams far more often than regular PM postings do.
What does not change is the core. Roadmapping, prioritization, stakeholder management and strategy are requested more often than almost any AI skill. The people who treat AI PM as a brand new profession prepare for the wrong interview. The AI PM vs PM guide breaks the difference down side by side.
How much experience you need
The median posting asks for 5 years. That one number explains more about who gets hired than any skill list.
1,640 postings, or 67% of the dataset, state a minimum number of years. Across those, the median is 5 years and the average is 5.9. The middle half of postings asks for 4 to 8 years. This market has settled on a narrow band, and it sits well above entry level.
Minimum years of experience asked for
1,640 postings that state a number.
Years of experience required
The data behind this chart
| Years | Postings |
|---|---|
| 0 | 8 |
| 1 | 22 |
| 2 | 105 |
| 3 | 208 |
| 4 | 119 |
| 5 | 497 |
| 6 | 101 |
| 7 | 142 |
| 8 | 194 |
| 9 | 8 |
| 10 | 156 |
| 11 | 1 |
| 12 | 44 |
| 13 | 2 |
| 15 | 24 |
| 20 | 7 |
Source: AI Product Manager Hiring Report 2026, analysis of 2,448 unique AI PM postings captured September 12, 2026.
Look at the spikes. Five years is by far the most common ask, with 497 postings. Three, eight and ten years are the next peaks. Employers write round numbers, so treat each spike as a threshold that recruiters and screening software actually filter on. If you have four years, you are competing for five-year roles. Apply anyway, and make your four years look like the five.
Experience bands
Share of postings that state an experience requirement.
The data behind this chart
| Band | Postings | Share |
|---|---|---|
| 0 to 2 years | 135 | 8.2% |
| 3 to 5 years | 824 | 50.2% |
| 6 to 7 years | 243 | 14.8% |
| 8 to 9 years | 202 | 12.3% |
| 10+ years | 236 | 14.4% |
Source: AI Product Manager Hiring Report 2026, analysis of 2,448 unique AI PM postings captured September 12, 2026.
The entry-level reality
Only 8.2% of postings that state a number accept two years or fewer. Entry and associate titles are 1.5% of the whole market. Both numbers say the same thing: there is almost no graduate pipeline into AI product management. The field is staffed by people moving across from nearby roles.
I am not going to soften that, because pretending otherwise wastes your time. But it is not a closed door. It is a two-step door. If you have less than three years of work experience, the fastest route is a nearby role at a company that ships AI: associate PM, product analyst, solutions engineer, forward-deployed engineer, technical program manager or product operations. Then you move inside. Internal moves skip the experience filter, because your manager already knows your work.
What counts as experience
Most postings ask for years of product management experience, or years of relevant experience. That second phrase is your opening. Years spent as an analyst who owned a metric, an engineer who shaped a roadmap, a consultant who ran discovery or a founder who shipped a product all count as relevant when you describe them in product terms.
So describe them that way. Do not write that you supported a launch. Write what you decided, what you measured and what changed. A resume that shows four years of product decisions reads as product experience, whatever the title said. The AI PM resume guide shows how to rewrite each line.
Experience by level and country
The steps between levels are smaller than most people expect. Mid-level and senior postings both ask for a median of 5 years. Lead roles ask for 6, and principal and executive roles ask for 8. The real difference between a senior and a principal posting is scope language, which chapter 11 measures.
Median experience asked, by level
The data behind this chart
| Level | Median years | Postings stating a number |
|---|---|---|
| Entry / Associate | 2 | 17 |
| Mid-level | 5 | 618 |
| Senior | 5 | 455 |
| Lead / Group PM | 6 | 124 |
| Principal / Distinguished | 8 | 264 |
| Executive (VP/Head/Director) | 8 | 162 |
Source: AI Product Manager Hiring Report 2026, analysis of 2,448 unique AI PM postings captured September 12, 2026.
Country barely matters. The United States, India, the United Kingdom, Canada, Germany, Singapore and Israel all sit at a median of five years. France is the one market that dips, at 4.5 years. Wherever you are, plan around five.
Do you need a degree?
Formal education is the most overweighted worry in AI product management. The postings are clear: shipped work gets screened first.
Only 21.7% of postings state a degree as a firm requirement. 53.3% never mention education at all. Another 11.1% name a degree but accept equivalent experience in the same sentence, and that wording is now close to standard.
How postings treat a degree
Every posting, by the strongest education wording it uses.
- Required
- Preferred
- Degree or equivalent experience
- Mentioned, strength unclear
- Not mentioned
The data behind this chart
| Wording | Postings | Share |
|---|---|---|
| Not mentioned | 1,306 | 53.3% |
| Required | 531 | 21.7% |
| Degree or equivalent experience | 272 | 11.1% |
| Mentioned (unspecified) | 180 | 7.4% |
| Preferred | 159 | 6.5% |
Source: AI Product Manager Hiring Report 2026, analysis of 2,448 unique AI PM postings captured September 12, 2026.
Put simply, nearly four postings in five will look at you without a degree if the rest of your profile holds up. That is the premise of the book this site exists for, and the data backs it. The no-degree guide shows how to build a profile that gets past the filters that remain.
Which degrees and fields show up
When a degree level is named, it is usually a bachelor’s, in 35.7% of all postings. A master’s appears in 22.8%, an MBA in 7.7% and a PhD in 2.3%. A posting can name more than one, so these do not add to 100.
Degree levels and fields named
Share of all postings. A posting can name several, so shares do not add to 100.
Degree level
Field of study
The data behind this chart
| Level or field | Postings | Share |
|---|---|---|
| Bachelor's | 874 | 35.7% |
| Master's | 559 | 22.8% |
| MBA | 189 | 7.7% |
| PhD | 56 | 2.3% |
| Computer Science / Engineering | 648 | 26.5% |
| Business / Management | 460 | 18.8% |
| Data Science / Statistics / Math | 246 | 10.0% |
| Engineering (general) | 69 | 2.8% |
| Design / HCI | 40 | 1.6% |
| Physical / Natural Sciences | 28 | 1.1% |
| AI / Machine Learning | 5 | 0.2% |
Source: AI Product Manager Hiring Report 2026, analysis of 2,448 unique AI PM postings captured September 12, 2026.
Computer science and engineering is the most named field at 26.5%, followed by business at 18.8%. Here is a detail I like: a degree specifically in AI or machine learning is named in 0.2% of postings. Employers are not asking for AI degrees. They are asking for people who can ship AI products.
Degrees by seniority
Degree requirements are strictest at both ends of the ladder. Entry roles require a degree 30% of the time, because graduates have nothing else to screen on. Executive roles require one 26% of the time and name an MBA in 14%. In the middle, where most of the hiring happens, lead roles require a degree just 17% of the time.
Degree wording by level
- Degree required
- Preferred, equivalent or unclear
- Not mentioned
The data behind this chart
| Level | Required | Not mentioned | MBA named | Postings |
|---|---|---|---|---|
| Entry / Associate | 29.7% | 40.5% | 8.1% | 37 |
| Mid-level | 21.2% | 59.2% | 6.5% | 1,002 |
| Senior | 23.1% | 48.8% | 7.9% | 648 |
| Lead / Group PM | 16.8% | 56.5% | 2.6% | 191 |
| Principal / Distinguished | 19.8% | 51.2% | 9.9% | 344 |
| Executive (VP/Head/Director) | 25.7% | 43.4% | 13.7% | 226 |
Source: AI Product Manager Hiring Report 2026, analysis of 2,448 unique AI PM postings captured September 12, 2026.
Does a degree requirement mean higher pay?
No. Postings that require a degree have a median posted salary of $186K. Postings that never mention education sit at $195K. That is an association, not proof that degrees lower pay. Degree language tracks the type of employer, and more traditional employers post both stricter requirements and lower ranges. Either way, the credential does not buy a premium.
Certifications
Certifications are mentioned in 12.3% of postings, and no single one works as a hiring signal. Scrum certifications lead at 2.5%. Any AI or ML certification appears in 0.6%. A cloud certification appears in almost none.
If you do not have a degree
Treat the degree filter as a routing problem, not a wall. Aim most of your applications at the postings that never mention education or that accept equivalent experience, which is the large majority. For the minority that require a degree, go through a referral, because a hiring manager who asks for you can usually get the requirement waived. And put your strongest proof at the top of your resume: the product you shipped, the metric you moved, the evaluation you ran.
The skills employers actually list
I matched every posting against 140 skills, with synonyms merged. The ranking is not what the internet told you.
Artificial intelligence appears in 99.1% of postings, which is expected for AI roles. The surprise is what comes next. Roadmapping at 76.1%. Communication at 70.8%. Prioritization at 67.4%. Stakeholder management at 63.6%. The first named AI technique, machine learning, only shows up at number ten.
The 25 most requested skills in AI PM postings
Share of postings naming each skill. Under each label: how often it sits in the must-have block when a posting separates requirements.
Highlighted: product management skills.
The data behind this chart
| Skill | Category | Postings | Share | Required share |
|---|---|---|---|---|
| Artificial Intelligence | AI & ML Foundations | 2,427 | 99.1% | 68% |
| Roadmapping | Product Management | 1,863 | 76.1% | 86% |
| Communication | Leadership & Human Skills | 1,734 | 70.8% | 85% |
| Prioritization | Product Management | 1,650 | 67.4% | 89% |
| Collaboration | Leadership & Human Skills | 1,632 | 66.7% | 77% |
| Stakeholder Management | Product Management | 1,557 | 63.6% | 89% |
| Cross-functional Leadership | Product Management | 1,389 | 56.7% | 85% |
| Product Strategy | Product Management | 1,295 | 52.9% | 78% |
| Ambiguity / Autonomy | Leadership & Human Skills | 1,292 | 52.8% | 81% |
| Machine Learning | AI & ML Foundations | 1,273 | 52.0% | 73% |
| AI Agents / Agentic AI | Modern GenAI Stack | 1,253 | 51.2% | 67% |
| Leadership | Leadership & Human Skills | 1,246 | 50.9% | 81% |
| Large Language Models | AI & ML Foundations | 1,130 | 46.2% | 74% |
| Financial Services | Domain Knowledge | 976 | 39.9% | 60% |
| Metrics & KPIs | Product Management | 972 | 39.7% | 88% |
| B2B / Enterprise Product | Product Management | 947 | 38.7% | 70% |
| Healthcare / Life Sciences | Domain Knowledge | 896 | 36.6% | 56% |
| Product Requirements (PRDs) | Product Management | 852 | 34.8% | 96% |
| Legal / RegTech | Domain Knowledge | 832 | 34.0% | 61% |
| Customer Empathy / UX | Product Management | 824 | 33.7% | 85% |
| Agile / Scrum | Product Management | 813 | 33.2% | 83% |
| Generative AI | AI & ML Foundations | 719 | 29.4% | 77% |
| REST APIs | Technical & Engineering | 692 | 28.3% | 63% |
| APIs | Technical & Engineering | 690 | 28.2% | 80% |
| Go-to-Market (GTM) | Product Management | 648 | 26.5% | 90% |
| Product Lifecycle Mgmt | Product Management | 627 | 25.6% | 86% |
| Data-Driven Decisions | Product Management | 597 | 24.4% | 84% |
| Partnerships / BD | Business & Commercial | 584 | 23.9% | 75% |
| Responsible AI / AI Ethics | Modern GenAI Stack | 568 | 23.2% | 67% |
| Mentorship / Coaching | Leadership & Human Skills | 518 | 21.2% | 71% |
| Problem Solving | Leadership & Human Skills | 505 | 20.6% | 89% |
| Experimentation & A/B Testing | Product Management | 492 | 20.1% | 81% |
| Model Evaluation / Evals | Modern GenAI Stack | 479 | 19.6% | 66% |
| Executive Communication | Leadership & Human Skills | 476 | 19.4% | 81% |
| Cybersecurity | Domain Knowledge | 470 | 19.2% | 59% |
| RAG (Retrieval-Augmented Generation) | Modern GenAI Stack | 466 | 19.0% | 76% |
| Adaptability / Learning | Leadership & Human Skills | 429 | 17.5% | 76% |
| Sales Enablement | Business & Commercial | 403 | 16.5% | 75% |
| Media / Entertainment | Domain Knowledge | 399 | 16.3% | 71% |
| Platform / API Product | Product Management | 399 | 16.3% | 72% |
| Public Sector / Defense | Domain Knowledge | 392 | 16.0% | 55% |
| E-commerce / Retail | Domain Knowledge | 387 | 15.8% | 57% |
| Business Strategy | Business & Commercial | 374 | 15.3% | 77% |
| P&L / Business Metrics | Business & Commercial | 368 | 15.0% | 79% |
| HR / Future of Work | Domain Knowledge | 342 | 14.0% | 61% |
| Guardrails & Safety | Modern GenAI Stack | 327 | 13.4% | 75% |
| Data Pipelines / ETL | Technical & Engineering | 322 | 13.2% | 66% |
| Anthropic / Claude | Tools & Platforms | 314 | 12.8% | 75% |
| Energy / Climate | Domain Knowledge | 311 | 12.7% | 73% |
| Prompt Engineering | Modern GenAI Stack | 309 | 12.6% | 78% |
| Dashboards & Reporting | Data & Analytics | 297 | 12.1% | 72% |
| Storytelling | Leadership & Human Skills | 294 | 12.0% | 79% |
| Data Analysis | Data & Analytics | 287 | 11.7% | 85% |
| Pricing & Monetization | Business & Commercial | 285 | 11.6% | 69% |
| System Design / Architecture | Technical & Engineering | 266 | 10.9% | 84% |
| Market Research | Business & Commercial | 265 | 10.8% | 84% |
| SQL | Technical & Engineering | 262 | 10.7% | 81% |
| Human-in-the-Loop | Modern GenAI Stack | 256 | 10.5% | 69% |
| Cloud Computing | Technical & Engineering | 249 | 10.2% | 68% |
| Product Discovery | Product Management | 245 | 10.0% | 78% |
Source: AI Product Manager Hiring Report 2026, analysis of 2,448 unique AI PM postings captured September 12, 2026. Skills matched with a 140-term dictionary.
The bars show how often each skill is named. The small number under each label is the required share: when a posting separates must-haves from nice-to-haves, how often the skill lands in the must-have block. That second number turns a frequency table into a list of real filters. Product requirement documents appear in only 35% of postings, but 96% of those mentions are hard requirements. Go-to-market sits at 90%. When those skills appear, they are gates.
Required versus preferred
Many job descriptions split the list in two: what you must have and what would be nice. Measuring skills against that split is the most useful way to read the demand data, because it separates gates from bonuses. Roadmapping sits in the must-have block 86% of the time. Stakeholder management sits there 89% of the time and prioritization 89%.
The AI skills are softer gates. AI agents land in the must-have block 67% of the time and large language models 74%. Employers still treat a lot of AI depth as something they can teach a strong product manager, and they do not treat product judgment the same way.
Six layers of the job
Read enough AI PM postings and the same six layers show up in almost all of them. What changes from role to role is how deep each layer goes.
01 · The actual job
Product
Roadmapping 76%, prioritization 67%, stakeholder management 64%, product strategy 53%. Screened hardest, and underprepared most often.
02 · How you work
Foundation
Communication 71%, collaboration 67%, working through ambiguity 53%. The most common reason a strong technical candidate gets rejected.
03 · Fluency, not research
AI
Machine learning 52%, agents 51%, LLMs 46%. Knowing what models can do, how they fail and what they cost to run.
04 · Enough to ask the right question
Technical
APIs 28%, data pipelines 13%, system design 11%, SQL 11%. Asked widely, rarely at engineering depth.
05 · Why it gets funded
Business
Partnerships 24%, sales enablement 16%, P&L 15%, pricing 12%. The layer that separates a feature owner from a product owner.
06 · Scope beyond yourself
Leadership
Leadership 51%, mentoring 21%, executive communication 19%. Grows sharply with seniority and pay.
How skills change as you climb
Skill requirements barely change between countries, but they change a lot between levels. Leadership is named in 40% of mid-level postings and 83% of executive postings. Product strategy climbs from 45% to 75%. Meanwhile PRD writing falls from 40% to 29%. Junior roles are hired to write the spec. Senior roles are hired to decide which specs get written.
How skill requests change with seniority
Share of postings at each level naming the skill.
| Level | Roadmapping | Communication | Prioritization | Stakeholders | Cross-functional | Product strategy | Ambiguity | Leadership | Machine learning | AI agents | LLMs | Metrics & KPIs | B2B product | PRDs |
|---|---|---|---|---|---|---|---|---|---|---|---|---|---|---|
| Entry37 | 30 | 65 | 41 | 51 | 57 | 19 | 32 | 32 | 35 | 57 | 49 | 35 | 24 | 27 |
| Mid-level1,002 | 69 | 67 | 63 | 65 | 49 | 45 | 47 | 40 | 49 | 46 | 46 | 40 | 31 | 40 |
| Senior648 | 80 | 74 | 73 | 64 | 64 | 57 | 59 | 54 | 53 | 53 | 46 | 43 | 44 | 35 |
| Lead / Group191 | 80 | 70 | 61 | 61 | 57 | 47 | 57 | 56 | 53 | 51 | 49 | 28 | 36 | 28 |
| Principal344 | 84 | 72 | 72 | 57 | 59 | 62 | 57 | 57 | 59 | 60 | 51 | 39 | 47 | 29 |
| Executive226 | 88 | 79 | 75 | 71 | 65 | 75 | 53 | 83 | 54 | 55 | 37 | 43 | 51 | 29 |
The data behind this chart
| Level | Roadmapping | Communication | Prioritization | Stakeholders | Cross-functional | Product strategy | Ambiguity | Leadership | Machine learning | AI agents | LLMs | Metrics & KPIs | B2B product | PRDs |
|---|---|---|---|---|---|---|---|---|---|---|---|---|---|---|
| Entry / Associate | 29.7% | 64.9% | 40.5% | 51.4% | 56.8% | 18.9% | 32.4% | 32.4% | 35.1% | 56.8% | 48.6% | 35.1% | 24.3% | 27.0% |
| Mid-level | 69.2% | 67.0% | 62.9% | 64.8% | 49.1% | 44.9% | 47.4% | 39.7% | 48.6% | 46.3% | 46.4% | 39.6% | 30.7% | 39.9% |
| Senior | 80.1% | 73.9% | 72.8% | 64.2% | 64.4% | 56.6% | 59.0% | 53.5% | 53.2% | 52.5% | 45.8% | 42.6% | 43.7% | 34.9% |
| Lead / Group PM | 80.1% | 70.2% | 61.3% | 60.7% | 56.5% | 46.6% | 56.5% | 55.5% | 52.9% | 51.3% | 48.7% | 28.3% | 36.1% | 27.7% |
| Principal / Distinguished | 84.0% | 72.1% | 71.8% | 57.3% | 59.3% | 61.6% | 57.0% | 57.0% | 59.3% | 59.9% | 50.6% | 39.2% | 47.1% | 28.5% |
| Executive (VP/Head/Director) | 87.6% | 78.8% | 74.8% | 70.8% | 65.0% | 75.2% | 52.7% | 82.7% | 54.4% | 54.9% | 36.7% | 42.9% | 51.3% | 28.8% |
| Level | Entry / Associate | Mid-level | Senior | Lead / Group PM | Principal / Distinguished | Executive (VP/Head/Director) |
|---|---|---|---|---|---|---|
| Roadmapping | 29.7% | 69.2% | 80.1% | 80.1% | 84.0% | 87.6% |
| Communication | 64.9% | 67.0% | 73.9% | 70.2% | 72.1% | 78.8% |
| Prioritization | 40.5% | 62.9% | 72.8% | 61.3% | 71.8% | 74.8% |
| Stakeholders | 51.4% | 64.8% | 64.2% | 60.7% | 57.3% | 70.8% |
| Cross-functional | 56.8% | 49.1% | 64.4% | 56.5% | 59.3% | 65.0% |
| Product strategy | 18.9% | 44.9% | 56.6% | 46.6% | 61.6% | 75.2% |
| Ambiguity | 32.4% | 47.4% | 59.0% | 56.5% | 57.0% | 52.7% |
| Leadership | 32.4% | 39.7% | 53.5% | 55.5% | 57.0% | 82.7% |
| Machine learning | 35.1% | 48.6% | 53.2% | 52.9% | 59.3% | 54.4% |
| AI agents | 56.8% | 46.3% | 52.5% | 51.3% | 59.9% | 54.9% |
| LLMs | 48.6% | 46.4% | 45.8% | 48.7% | 50.6% | 36.7% |
| Metrics & KPIs | 35.1% | 39.6% | 42.6% | 28.3% | 39.2% | 42.9% |
| B2B product | 24.3% | 30.7% | 43.7% | 36.1% | 47.1% | 51.3% |
| PRDs | 27.0% | 39.9% | 34.9% | 27.7% | 28.5% | 28.8% |
Source: AI Product Manager Hiring Report 2026, analysis of 2,448 unique AI PM postings captured September 12, 2026.
The same comparison across countries is flat. A senior posting in London looks more like a senior posting in San Francisco than like a mid-level posting in London. If you prepare for the level, you are prepared for the market.
Skills that travel together
Employers bundle skills. Some pairs appear together much more often than their separate frequencies would predict, which tells you what to build at the same time rather than one after the other. B2B product experience and go-to-market appear together 1.53 times more than chance. Generative AI and responsible AI pair at 1.50. Leadership and mentoring pair at 1.47. LLMs and APIs pair at 1.37, so if you learn one, learn the other.
Skills employers bundle together
Lift: how many times more often the pair appears together than chance would predict.
The data behind this chart
| Skill A | Skill B | Postings with both | Lift |
|---|---|---|---|
| Financial Services | Healthcare / Life Sciences | 557 | 1.56 |
| B2B / Enterprise Product | Go-to-Market (GTM) | 383 | 1.53 |
| Generative AI | Responsible AI / AI Ethics | 250 | 1.50 |
| Leadership | Mentorship / Coaching | 388 | 1.47 |
| Go-to-Market (GTM) | Partnerships / BD | 222 | 1.44 |
| Metrics & KPIs | Responsible AI / AI Ethics | 322 | 1.43 |
| Product Requirements (PRDs) | Agile / Scrum | 402 | 1.42 |
| Healthcare / Life Sciences | Legal / RegTech | 421 | 1.38 |
| Large Language Models | APIs | 436 | 1.37 |
| Metrics & KPIs | Data-Driven Decisions | 325 | 1.37 |
| Data-Driven Decisions | Mentorship / Coaching | 172 | 1.36 |
| Customer Empathy / UX | Data-Driven Decisions | 271 | 1.35 |
| Legal / RegTech | Responsible AI / AI Ethics | 260 | 1.35 |
| Partnerships / BD | Responsible AI / AI Ethics | 181 | 1.34 |
| AI Agents / Agentic AI | Large Language Models | 771 | 1.33 |
| Product Strategy | Go-to-Market (GTM) | 457 | 1.33 |
| Agile / Scrum | Responsible AI / AI Ethics | 251 | 1.33 |
| Metrics & KPIs | Agile / Scrum | 426 | 1.32 |
| AI Agents / Agentic AI | APIs | 461 | 1.31 |
| Product Lifecycle Mgmt | Data-Driven Decisions | 200 | 1.31 |
| Product Strategy | Mentorship / Coaching | 357 | 1.30 |
| B2B / Enterprise Product | APIs | 343 | 1.29 |
| Agile / Scrum | Generative AI | 309 | 1.29 |
| Product Strategy | Product Lifecycle Mgmt | 426 | 1.28 |
| Legal / RegTech | Partnerships / BD | 254 | 1.28 |
Source: AI Product Manager Hiring Report 2026, analysis of 2,448 unique AI PM postings captured September 12, 2026.
Want these skills turned into resume language? The AI PM resume keywords guide lists the exact terms, and the AI PM skills guide explains how to build each one.
Agents, RAG, evals: what the AI stack really looks like
This is where the gap between what candidates study and what employers write down is widest.
Agents are the loudest topic in AI right now, and for once the hype matches the hiring. 51.2% of postings name AI agents or agentic workflows, more than the 46.2% that name large language models. Generative AI as a term appears in 29.4%, often as a label for the product rather than a requirement.
The modern AI stack, measured
Share of postings naming each AI capability.
Highlighted: agents, evals and RAG.
The data behind this chart
| Capability | Postings | Share |
|---|---|---|
| Artificial Intelligence | 2,427 | 99.1% |
| Machine Learning | 1,273 | 52.0% |
| AI Agents / Agentic AI | 1,253 | 51.2% |
| Large Language Models | 1,130 | 46.2% |
| Generative AI | 719 | 29.4% |
| Responsible AI / AI Ethics | 568 | 23.2% |
| Model Evaluation / Evals | 479 | 19.6% |
| RAG (Retrieval-Augmented Generation) | 466 | 19.0% |
| Guardrails & Safety | 327 | 13.4% |
| Prompt Engineering | 309 | 12.6% |
| Human-in-the-Loop | 256 | 10.5% |
| Fine-tuning | 173 | 7.1% |
| Embeddings | 173 | 7.1% |
| Hallucination Mitigation | 135 | 5.5% |
| Natural Language Processing | 127 | 5.2% |
| Vector Search | 113 | 4.6% |
| Recommendation Systems | 93 | 3.8% |
| Context Engineering | 88 | 3.6% |
| Predictive Analytics | 81 | 3.3% |
| Foundation Models | 80 | 3.3% |
| Multimodal AI | 68 | 2.8% |
| Computer Vision | 60 | 2.5% |
| Deep Learning | 47 | 1.9% |
| Speech / Voice AI | 45 | 1.8% |
| Synthetic Data | 8 | 0.3% |
Source: AI Product Manager Hiring Report 2026, analysis of 2,448 unique AI PM postings captured September 12, 2026.
Below the top four, the numbers fall fast. Responsible AI appears in 23.2%. Evals in 19.6%. RAG in 19.0%. Guardrails in 13.4%, prompt engineering in 12.6%, fine-tuning in 7.1% and context engineering in 3.6%.
Read that the right way. Low frequency does not mean low value. It means these techniques are not yet table stakes, which is exactly why they move you up a shortlist. Every candidate claims AI fluency. Very few can show a RAG system they measured or an eval set they built.
Evals: the AI skill to learn first
If you learn one AI skill this year, make it evaluation. It appears in 19.6% of postings, it transfers across every role type and industry in this dataset, and when a posting splits requirements from preferences, evals are a requirement 66% of the time. Evaluation is how an employer decides whether an AI feature is good enough to ship. The person who owns that decision owns the product.
Fine-tuning looks tempting because it correlates with higher pay, which chapter 11 shows. But it appears in 7.1% of postings, it is expensive to learn, and it clusters in platform roles. Learn evals first, then pick up fine-tuning if your target role needs it. The AI evaluation guide is the place to start.
What each technique signals
- Agents (51%). Usually paired with tool use, permissions and failure recovery. The agents guide covers the product decisions.
- RAG (19%). Appears less than the online noise suggests, but almost always in roles with a real search or knowledge surface. When it is named, it is a requirement 76% of the time. See the RAG guide.
- Responsible AI (23%). Concentrated in regulated industries and large employers, where it is close to mandatory.
- Prompt engineering (13%). Rarely a standalone requirement. It shows up as one part of a design responsibility, and it leans toward lower-paying roles.
- Human in the loop (10%). A product requirement about escalation and review, not a research topic.
- Context engineering (4%). The newest term in the dictionary. Small today, and the number to watch in the 2027 edition.
How to show agent experience without an agent job
Most people applying for agentic roles have never held one, so nobody expects a job title. They expect judgment. Take one workflow you know well, like expense approval or support ticket triage, and write down what an agent should do alone, what needs a human yes, how it recovers when a step fails and how you would measure whether it is safe to widen its permissions. That single page answers the question every agent interview asks, and very few candidates bring it.
Named tools and platforms
Vendor tools are the least requested category in the dataset, and that is a useful warning against framework tourism. Still, the ranking is interesting. Anthropic’s Claude is named in 12.8% of postings, ahead of the Model Context Protocol at 8.7%, Jira at 8.1% and OpenAI at 8.0%. LangChain sits at 3.6%. LlamaIndex, Pinecone and the other vector databases are each named in under one percent of postings.
Named tools and platforms
Share of postings naming each vendor tool.
The data behind this chart
| Tool | Postings | Share |
|---|---|---|
| Anthropic / Claude | 314 | 12.8% |
| Model Context Protocol (MCP) | 213 | 8.7% |
| Jira / Confluence | 198 | 8.1% |
| OpenAI | 195 | 8.0% |
| Google Gemini | 102 | 4.2% |
| Tableau / Power BI / Looker | 101 | 4.1% |
| Snowflake | 101 | 4.1% |
| Excel / Spreadsheets | 100 | 4.1% |
| LangChain | 87 | 3.6% |
| Salesforce | 83 | 3.4% |
| Figma | 80 | 3.3% |
| Azure OpenAI | 64 | 2.6% |
| AWS Bedrock / SageMaker | 51 | 2.1% |
| LangGraph | 49 | 2.0% |
| Amplitude / Mixpanel | 37 | 1.5% |
| Notebooks (Jupyter) | 32 | 1.3% |
| PyTorch / TensorFlow | 29 | 1.2% |
| LlamaIndex | 23 | 0.9% |
| Hugging Face | 14 | 0.6% |
| MLflow / W&B | 11 | 0.4% |
| Weaviate / Qdrant / Milvus/ FAISS | 6 | 0.2% |
| Pinecone | 5 | 0.2% |
Source: AI Product Manager Hiring Report 2026, analysis of 2,448 unique AI PM postings captured September 12, 2026.
Tools change every year. The concepts underneath them do not. Be conversant in the tools your target employers use, but spend your study time on concepts: how retrieval works, how agents fail, how you measure quality.
How technical do you need to be?
Technical enough to ask the right question. Almost never technical enough to write production code.
This is the belief I most wanted to test, because it stops more people from even trying. The answer is clear. 83.8% of AI PM postings do not name a single programming language. Python appears in 9.0% and SQL in 10.7%. Only 4.4% ask for both.
How many postings ask you to code
Each square is one percent of all postings.
84% name no programming language
16% name at least one
- Python9.0%
- SQL10.7%
- Python and SQL together4.4%
- Any cloud platform19.9%
The data behind this chart
| Measure | Share of postings |
|---|---|
| No programming language | 83.8% |
| Any programming language | 16.2% |
| Python or SQL | 15.3% |
| Python and SQL | 4.4% |
| Any cloud platform | 19.9% |
Source: AI Product Manager Hiring Report 2026, analysis of 2,448 unique AI PM postings captured September 12, 2026.
When Python does appear, the surrounding language is usually analytical: query the data, prototype against an API, read a notebook. It is rarely about building production systems. SQL is the more honest technical ask. When it is named, it is tied to a concrete responsibility like owning your metrics or checking a model’s impact yourself.
Technical skills named in AI PM postings
Share of postings. APIs lead, programming languages trail.
The data behind this chart
| Skill | Postings | Share |
|---|---|---|
| REST APIs | 692 | 28.3% |
| APIs | 690 | 28.2% |
| Data Pipelines / ETL | 322 | 13.2% |
| System Design / Architecture | 266 | 10.9% |
| SQL | 262 | 10.7% |
| Cloud Computing | 249 | 10.2% |
| AWS | 236 | 9.6% |
| Microsoft Azure | 228 | 9.3% |
| Python | 220 | 9.0% |
| Big Data (Spark/Hadoop) | 155 | 6.3% |
| MLOps | 144 | 5.9% |
| Google Cloud (GCP) | 131 | 5.4% |
| Git / Version Control | 87 | 3.6% |
| JavaScript / TypeScript | 58 | 2.4% |
| LLMOps | 53 | 2.2% |
| Kubernetes | 52 | 2.1% |
| Docker | 18 | 0.7% |
| Java | 10 | 0.4% |
Source: AI Product Manager Hiring Report 2026, analysis of 2,448 unique AI PM postings captured September 12, 2026.
The real technical bar
APIs are the real literacy test. They appear in 28.2% of postings, roughly three times as often as Python. Understanding rate limits, latency, token cost, retries and failure modes matters more in these postings than syntax. Cloud platforms appear in 19.9% of postings, and system design in 10.9%, mostly in senior and platform roles.
- A mention is not a bar. Postings name Python far more often than they describe a coding task.
- SQL is the honest requirement. It usually comes with metrics you will own.
- APIs are the real test. Know how a model call works, what it costs and how it breaks.
- Architecture grows with level. System design shows up in principal and platform roles far more than mid-level ones.
What API literacy looks like in practice
You do not need to write the integration. You need to hold your own in the meeting about it. When an engineer says a feature needs three model calls per request, you should ask what that does to response time and to cost at your expected volume. When a vendor promises accuracy, you should ask how they measured it and on whose data. When a call fails, you should know whether the product retries, falls back to a simpler answer or tells the user. Those questions come from understanding, not from coding.
If you are coming from a non-technical background, this is the chapter to screenshot. The zero to AI PM roadmap sequences exactly this level of technical learning.
What AI product managers get paid
Measured from 904 salary ranges employers published in the postings themselves. No surveys, no self-reported guesses.
36.9% of postings disclose a pay range. Across those 904 ranges, the median midpoint is $193K. The middle half of roles pays between $159K and $226K, and the top tenth starts at $265K.
- 25th percentile
- $159K
- Median
- $193K
- 904 postings
- 75th percentile
- $226K
- 90th percentile
- $265K
How posted AI PM salaries are distributed
904 posted ranges, midpoint in US dollars.
Posted salary midpoint (USD). Highlighted: the band holding the median.
The data behind this chart
| Salary band | Postings |
|---|---|
| Under $60K | 1 |
| $60K to $90K | 17 |
| $90K to $120K | 49 |
| $120K to $150K | 122 |
| $150K to $180K | 183 |
| $180K to $210K | 208 |
| $210K to $240K | 157 |
| $240K to $280K | 102 |
| $280K to $350K | 53 |
| $350K+ | 12 |
Source: AI Product Manager Hiring Report 2026. Posted salary midpoints in US dollars, 904 postings that disclose pay.
Two rules before you use any of these numbers. They are posted ranges, which means advertised base pay, not accepted offers, and they leave out bonus and equity. And cross-country comparisons are straight conversions to US dollars at the exchange rate on the capture date, with no adjustment for cost of living or tax. Compare inside a market first.
Pay by level
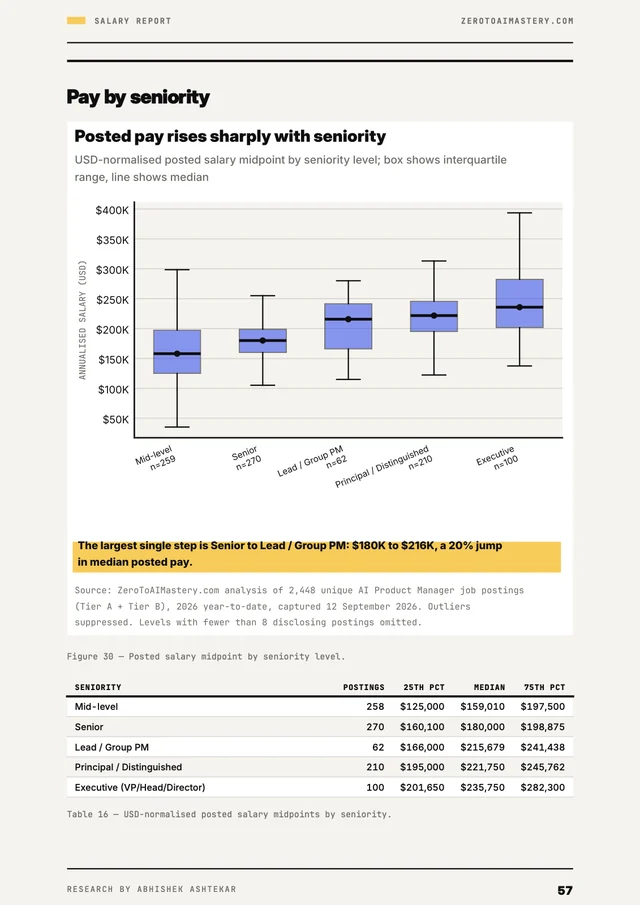
Level moves pay more than anything else in this dataset. The median climbs from $159K for mid-level roles to $236K for executives, a 48% rise. The biggest single step is senior to lead, where the median jumps 20% from $180K to $216K. That is the promotion to chase.
Posted salary by level
Dot: median. Bar: the middle half of postings (25th to 75th percentile).
The data behind this chart
| Level | Postings with pay | 25th percentile | Median | 75th percentile |
|---|---|---|---|---|
| Mid-level | 258 | $125K | $159K | $198K |
| Senior | 270 | $160K | $180K | $199K |
| Lead / Group PM | 62 | $166K | $216K | $241K |
| Principal / Distinguished | 210 | $195K | $222K | $246K |
| Executive (VP/Head/Director) | 100 | $202K | $236K | $282K |
Source: AI Product Manager Hiring Report 2026. Posted salary midpoints in US dollars, 904 postings that disclose pay.
Find your number
Pick your level and your market. The finder shows the median posted salary and the middle half of the range, straight from the postings. It only shows a number when at least 15 postings back it.
AI PM pay finder
Median posted salary and the middle half of the range, by level and market.
United States · All levels
$198K
Middle half: $168K to $231K
Based on 774 postings that disclose pay.
The data behind this chart
| Market | Level | Postings with pay | Median | Middle half |
|---|---|---|---|---|
| All markets | All levels | 904 | $193K | $159K to $226K |
| All markets | Mid-level | 258 | $159K | $125K to $198K |
| All markets | Senior | 270 | $180K | $160K to $199K |
| All markets | Lead / Group PM | 62 | $216K | $166K to $241K |
| All markets | Principal / Distinguished | 210 | $222K | $195K to $246K |
| All markets | Executive (VP/Head/Director) | 100 | $236K | $202K to $282K |
| United States | All levels | 774 | $198K | $168K to $231K |
| United States | Mid-level | 215 | $170K | $136K to $201K |
| United States | Senior | 225 | $188K | $170K to $200K |
| United States | Lead / Group PM | 57 | $218K | $166K to $242K |
| United States | Principal / Distinguished | 183 | $226K | $206K to $257K |
| United States | Executive (VP/Head/Director) | 90 | $241K | $211K to $284K |
| Canada | All levels | 63 | $143K | $125K to $169K |
| Canada | Mid-level | 21 | $125K | $101K to $133K |
| Canada | Senior | 18 | $151K | $136K to $162K |
| Canada | Lead / Group PM | 1 | Too few postings | |
| Canada | Principal / Distinguished | 15 | $165K | $133K to $169K |
| Canada | Executive (VP/Head/Director) | 8 | Too few postings | |
| San Francisco Bay Area | All levels | 203 | $223K | $198K to $258K |
| San Francisco Bay Area | Mid-level | 41 | $195K | $175K to $205K |
| San Francisco Bay Area | Senior | 62 | $200K | $195K to $220K |
| San Francisco Bay Area | Lead / Group PM | 20 | $243K | $234K to $250K |
| San Francisco Bay Area | Principal / Distinguished | 61 | $238K | $222K to $269K |
| San Francisco Bay Area | Executive (VP/Head/Director) | 19 | $303K | $280K to $324K |
| New York | All levels | 79 | $202K | $178K to $232K |
| New York | Mid-level | 18 | $185K | $170K to $219K |
| New York | Senior | 26 | $189K | $162K to $211K |
| New York | Lead / Group PM | 4 | Too few postings | |
| New York | Principal / Distinguished | 18 | $233K | $206K to $268K |
| New York | Executive (VP/Head/Director) | 12 | Too few postings | |
| Seattle | All levels | 62 | $209K | $178K to $229K |
| Seattle | Mid-level | 7 | Too few postings | |
| Seattle | Senior | 27 | $179K | $178K to $199K |
| Seattle | Lead / Group PM | 2 | Too few postings | |
| Seattle | Principal / Distinguished | 24 | $214K | $209K to $239K |
| Seattle | Executive (VP/Head/Director) | 2 | Too few postings |
Source: AI Product Manager Hiring Report 2026. Posted salary midpoints in US dollars, 904 postings that disclose pay. Shown only where at least 15 postings disclose pay.
Pay by country
Salary disclosure depends on the law. The United States accounts for 86% of all pay-disclosing postings because several states require a range in the ad. US postings have a median of $198K, with the middle half between $168K and $231K. Canada’s 63 disclosing postings have a median of $143K in US dollars.
Outside North America, disclosure collapses. Only 13 UK postings list pay, which is too few to publish as a headline, and not one of the 181 Indian postings disclosed a range. For those markets, use the country salary guides, which draw on larger self-reported datasets: UK, India, Germany.
If you live outside the United States, do not read the gap as a reason to give up on your market. Compare yourself with the pay in your own country first, then look at US-headquartered employers hiring locally, because they often post ranges closer to their home market. Canadian roles attached to US companies are a good example, and they are also the most likely to be fully remote.
Median posted salary by city
Cities with at least 30 postings that disclose pay.
The data behind this chart
| City | Postings with pay | Median |
|---|---|---|
| Atlanta | 14 | $182K |
| Austin | 16 | $186K |
| Boston | 36 | $161K |
| Charlotte | 10 | $165K |
| Chicago | 22 | $166K |
| London | 11 | $115K |
| New York | 79 | $202K |
| San Diego | 11 | $245K |
| San Francisco | 116 | $222K |
| San Jose | 77 | $222K |
| Seattle | 62 | $209K |
| Toronto | 36 | $144K |
| Vancouver | 12 | $136K |
| Washington DC | 14 | $180K |
Source: AI Product Manager Hiring Report 2026. Posted salary midpoints in US dollars, 904 postings that disclose pay. The data table also lists smaller cities.
The Bay Area pays the most. San Francisco and San Jose both post a median of $222K. Seattle follows at $209K and New York at $202K. Boston is the outlier among big US hubs at $161K, and Toronto leads Canada at $144K.
Pay by industry and role type
Healthcare pays the least of any major sector, with a median of $163K. Developer tools and big tech sit near $209K. Manufacturing tops the table at $223K, but on only 22 postings, so treat it as a signal and not a rule.
Median posted salary by industry
Industries with at least 10 postings that disclose pay.
The data behind this chart
| Industry | Postings with pay | Median |
|---|---|---|
| Manufacturing & Industrial | 22 | $223K |
| Big Tech & Consumer Internet | 27 | $209K |
| Developer Tools & Infrastructure | 74 | $209K |
| Media, Gaming & Entertainment | 20 | $206K |
| AI / ML Native | 34 | $205K |
| Enterprise Software & SaaS | 200 | $198K |
| Financial Services & FinTech | 134 | $195K |
| Cybersecurity | 36 | $195K |
| Telecom & Networking | 15 | $186K |
| Public Sector & Defense | 14 | $178K |
| E-commerce & Retail | 49 | $178K |
| Other / Unclassified | 115 | $177K |
| Consulting & Professional Services | 14 | $173K |
| Healthcare & Life Sciences | 105 | $163K |
Source: AI Product Manager Hiring Report 2026. Posted salary midpoints in US dollars, 904 postings that disclose pay.
Across the eight role types, AI platform PMs lead at $204K and applied AI PMs trail at $175K. The spread between role types is much smaller than the spread between levels. Choose your type for fit, then climb for money.
Pay and experience
Posted pay rises steadily with the experience a posting asks for. Roles asking for two or three years have a median of $173K. Five years sits at $185K, eight years at $209K and ten at $225K. Even the entry end of this market pays well above typical product manager starting salaries, because the roles that ask for two years are rarely junior roles.
Posted salary by years of experience required
Median posted salary for each stated minimum.
Minimum years of experience in the posting
The data behind this chart
| Years required | Postings with pay | Median |
|---|---|---|
| 2 | 37 | $173K |
| 3 | 77 | $173K |
| 4 | 47 | $185K |
| 5 | 201 | $185K |
| 6 | 50 | $199K |
| 7 | 73 | $198K |
| 8 | 91 | $209K |
| 10 | 79 | $225K |
| 12 | 23 | $227K |
| 15 | 12 | $252K |
Source: AI Product Manager Hiring Report 2026. Posted salary midpoints in US dollars, 904 postings that disclose pay.
How to use these numbers in a negotiation
Start with the pay finder, not with the global median. Your level and your market move the number far more than anything else. Take the median for your cell as your anchor and the top of the middle half as your stretch.
Then remember what these numbers leave out. A posted range is base pay. Bonus, equity and sign-on money sit on top, and at larger companies they add a lot. If a recruiter quotes a base below the middle of the posted range for your level, you have data to push back with. If they quote total compensation, ask for the base on its own so you compare like with like.
Finally, look at the posting itself. Many US roles now publish a range. Aim for the upper half of that range when your experience matches the level, and name the scope you will own. Chapter 11 shows why scope is the lever that moves pay.
Remote, hybrid or office
Remote work exists, but it is the exception, and it depends far more on the country than on the role.
13.0% of postings are fully remote. 24.6% are hybrid and 14.7% are fully on-site. The remaining 47.8% name a location but never say how the work is set up, which usually means an office with some flexibility you negotiate later.
Working model across all postings
- Remote
- Hybrid
- On-site
- Not specified
The data behind this chart
| Working model | Postings | Share |
|---|---|---|
| Not specified | 1,169 | 47.8% |
| Hybrid | 601 | 24.6% |
| On-site | 360 | 14.7% |
| Remote | 318 | 13.0% |
Source: AI Product Manager Hiring Report 2026, analysis of 2,448 unique AI PM postings captured September 12, 2026.
Remote work depends on the country
Canada is the most remote-friendly large market, with 26% of roles fully remote. The United States and the United Kingdom sit near 13%. Germany and the UK lean hard into hybrid at 37% and 35%. India is at 4.4% fully remote, Singapore at 1.7%, and not one Israeli posting was fully remote.
Working model by country
Markets with at least 30 postings. Grey: no working model stated.
- Remote
- Hybrid
- On-site
- Not specified
The data behind this chart
| Country | Remote | Hybrid | On-site | Postings |
|---|---|---|---|---|
| Canada | 26.0% | 27.9% | 14.4% | 104 |
| Spain | 14.3% | 26.2% | 16.7% | 42 |
| France | 13.6% | 18.6% | 11.9% | 59 |
| United Kingdom | 13.5% | 34.6% | 9.0% | 133 |
| United States | 13.3% | 24.2% | 18.5% | 1,283 |
| Germany | 8.6% | 36.6% | 6.5% | 93 |
| India | 4.4% | 11.6% | 14.9% | 181 |
| Singapore | 1.7% | 19.0% | 12.1% | 58 |
| Israel | 0.0% | 31.9% | 6.4% | 47 |
Source: AI Product Manager Hiring Report 2026, analysis of 2,448 unique AI PM postings captured September 12, 2026.
Level matters less. Principal roles are the most likely to be remote at 19%, because employers will bend location rules for scarce senior people. Executives are the most likely to be fully on-site at 21%.
Remote roles post lower pay
Fully remote postings have a median of $180,000. Hybrid postings sit at $198,500, which is $18,500 higher. Part of that gap is location pay bands, and part is the type of company that hires remote. Either way, remote costs you something at the offer stage.
Remote roles also attract more applicants per opening, because location no longer filters anyone out. If a remote role is your only target, expect a longer search and make your application stronger than you would for a hybrid role in your own city.
The skills worth learning first
Frequency tells you what is common. Pay tells you what correlates with seniority. Neither tells you what to learn next, so I built a score that does.
Ranking by raw frequency rewards skills so common they cannot set you apart. Ranking by pay rewards skills that simply show up in senior roles. The Skill Opportunity Score blends five parts you can check yourself:
- Demand. How often the skill appears, on a log scale, so going from rare to common counts more than going from common to universal.
- Differentiation. Highest for skills named in roughly a third of postings. Common enough to matter, rare enough that most candidates lack it.
- Pay signal. The gap in median posted pay between postings that name the skill and postings that do not, floored at zero.
- Portability. The share of industries where the skill appears, so it survives a change of sector.
- Gate strength. How often the skill lands in the must-have block rather than the nice-to-have block.
Skill Opportunity Score: the top 15
Composite of demand, differentiation, pay signal, portability and the strength of the gate. 0 to 100.
The data behind this chart
| Skill | Score | Share of postings | Differentiation | Gate strength |
|---|---|---|---|---|
| Product Requirements (PRDs) | 75.4 | 34.8% | 100 | 96 |
| B2B / Enterprise Product | 73.0 | 38.7% | 92 | 70 |
| Customer Empathy / UX | 72.9 | 33.7% | 97 | 85 |
| Go-to-Market (GTM) | 72.7 | 26.5% | 81 | 90 |
| Metrics & KPIs | 72.3 | 39.7% | 90 | 88 |
| Agile / Scrum | 72.2 | 33.2% | 96 | 83 |
| Partnerships / BD | 69.5 | 23.9% | 75 | 75 |
| Product Lifecycle Mgmt | 69.1 | 25.6% | 79 | 86 |
| Legal / RegTech | 69.0 | 34.0% | 98 | 61 |
| Generative AI | 69.0 | 29.4% | 88 | 77 |
| REST APIs | 68.8 | 28.3% | 85 | 63 |
| APIs | 68.8 | 28.2% | 85 | 80 |
| Leadership | 68.3 | 50.9% | 65 | 81 |
| Healthcare / Life Sciences | 68.2 | 36.6% | 96 | 56 |
| Ambiguity / Autonomy | 67.5 | 52.8% | 60 | 81 |
| Financial Services | 67.5 | 39.9% | 89 | 60 |
| Large Language Models | 67.3 | 46.2% | 75 | 74 |
| Data-Driven Decisions | 67.1 | 24.4% | 76 | 84 |
| Mentorship / Coaching | 66.9 | 21.2% | 69 | 71 |
| Adaptability / Learning | 65.6 | 17.5% | 61 | 76 |
| Problem Solving | 65.5 | 20.6% | 68 | 89 |
| Product Strategy | 65.4 | 52.9% | 60 | 78 |
| Cross-functional Leadership | 64.8 | 56.7% | 52 | 85 |
| Machine Learning | 64.8 | 52.0% | 62 | 73 |
| AI Agents / Agentic AI | 64.3 | 51.2% | 64 | 67 |
| Executive Communication | 64.1 | 19.4% | 65 | 81 |
| System Design / Architecture | 64.0 | 10.9% | 46 | 84 |
| Platform / API Product | 63.5 | 16.3% | 58 | 72 |
| Experimentation & A/B Testing | 63.4 | 20.1% | 67 | 81 |
| Customer Obsession | 62.9 | 9.9% | 44 | 84 |
| Responsible AI / AI Ethics | 62.8 | 23.2% | 74 | 67 |
| Stakeholder Management | 62.6 | 63.6% | 36 | 89 |
| RAG (Retrieval-Augmented Generation) | 62.2 | 19.0% | 64 | 76 |
| P&L / Business Metrics | 62.1 | 15.0% | 56 | 79 |
| Media / Entertainment | 61.8 | 16.3% | 58 | 71 |
| Model Evaluation / Evals | 61.6 | 19.6% | 66 | 66 |
| Sales Enablement | 61.6 | 16.5% | 59 | 75 |
| Storytelling | 61.6 | 12.0% | 49 | 79 |
| Prioritization | 60.9 | 67.4% | 28 | 89 |
| Fine-tuning | 60.2 | 7.1% | 38 | 75 |
Source: AI Product Manager Hiring Report 2026, analysis of 2,448 unique AI PM postings captured September 12, 2026.
The top of the table is not glamorous, and that is the point. PRD writing scores 75. B2B product experience, customer empathy and go-to-market all score 73. Metrics and agile follow. These are the skills hiring managers screen for and candidates skip because they feel old-fashioned.
The skill matrix
Here is the same idea as a picture. Across the bottom, how often a skill is named. Up the side, how much more US postings pay when they name it. Skills in the top right are common and well paid. Skills in the top left are rare and well paid, the specialist bets. Hover or tap any dot.
The skill matrix: how common vs how well paid
Each dot is a skill. Across: share of all postings naming it (log scale). Up: US median posted pay with the skill vs without it.
The data behind this chart
| Skill | Share of postings | US pay difference | US postings with skill |
|---|---|---|---|
| Fine-tuning | 7.1% | +14.2% | 66 |
| Developer Tools | 8.0% | +11.2% | 60 |
| Customer Obsession | 9.9% | +11.1% | 91 |
| System Design / Architecture | 10.9% | +10.7% | 97 |
| Budget / Resource Mgmt | 8.6% | +7.1% | 64 |
| Adaptability / Learning | 17.5% | +6.7% | 132 |
| Partnerships / BD | 23.9% | +6.4% | 229 |
| Mentorship / Coaching | 21.2% | +6.3% | 194 |
| Storytelling | 12.0% | +5.9% | 120 |
| Platform / API Product | 16.3% | +5.7% | 144 |
| Media / Entertainment | 16.3% | +5.4% | 146 |
| Pricing & Monetization | 11.6% | +5.2% | 91 |
| B2B / Enterprise Product | 38.7% | +5.1% | 323 |
| Go-to-Market (GTM) | 26.5% | +5.0% | 264 |
| REST APIs | 28.3% | +4.4% | 275 |
| Competitive Analysis | 9.3% | +4.3% | 85 |
| Roadmapping | 76.1% | +3.6% | 622 |
| Critical Thinking | 6.7% | +3.5% | 64 |
| P&L / Business Metrics | 15.0% | +3.4% | 142 |
| Sales Enablement | 16.5% | +3.0% | 130 |
| Manufacturing / Industrial | 9.3% | +2.9% | 57 |
| Ambiguity / Autonomy | 52.8% | +2.6% | 461 |
| Leadership | 50.9% | +2.6% | 441 |
| Influence w/o Authority | 9.0% | +2.4% | 98 |
| Embeddings | 7.1% | +1.6% | 52 |
| Product Lifecycle Mgmt | 25.6% | +1.5% | 201 |
| Executive Communication | 19.4% | +1.3% | 202 |
| Public Sector / Defense | 16.0% | +1.3% | 172 |
| E-commerce / Retail | 15.8% | +1.3% | 131 |
| Compliance & Regulation | 8.7% | +1.2% | 70 |
| Model Evaluation / Evals | 19.6% | +1.1% | 169 |
| Guardrails & Safety | 13.4% | +1.1% | 103 |
| Customer Interviews | 6.7% | +1.0% | 53 |
| Human-in-the-Loop | 10.5% | +0.9% | 80 |
| AI Agents / Agentic AI | 51.2% | +0.3% | 449 |
| Product Strategy | 52.9% | +0.3% | 461 |
| Experimentation & A/B Testing | 20.1% | +0.3% | 181 |
| Market Research | 10.8% | +0.2% | 64 |
| Model Context Protocol (MCP) | 8.7% | -0.2% | 68 |
| User Research | 9.5% | -0.8% | 75 |
| Cross-functional Leadership | 56.7% | -1.3% | 496 |
| Supply Chain / Logistics | 8.1% | -1.4% | 65 |
| AWS | 9.6% | -1.4% | 83 |
| SQL | 10.7% | -2.0% | 91 |
| Large Language Models | 46.2% | -2.1% | 367 |
| Legal / RegTech | 34.0% | -2.1% | 353 |
| Machine Learning | 52.0% | -2.2% | 439 |
| Customer Empathy / UX | 33.7% | -2.5% | 263 |
| Generative AI | 29.4% | -2.5% | 228 |
| Data-Driven Decisions | 24.4% | -2.8% | 186 |
| Data Governance | 9.8% | -2.9% | 77 |
| Data Pipelines / ETL | 13.2% | -3.3% | 115 |
| APIs | 28.2% | -3.4% | 216 |
| Cloud Computing | 10.2% | -3.7% | 94 |
| Prioritization | 67.4% | -3.7% | 541 |
| Problem Solving | 20.6% | -3.8% | 161 |
| Energy / Climate | 12.7% | -3.8% | 96 |
| Cybersecurity | 19.2% | -3.8% | 137 |
| Collaboration | 66.7% | -3.8% | 539 |
| RAG (Retrieval-Augmented Generation) | 19.0% | -4.6% | 122 |
| Communication | 70.8% | -4.9% | 572 |
| Financial Services | 39.9% | -5.0% | 381 |
| Metrics & KPIs | 39.7% | -5.4% | 311 |
| Responsible AI / AI Ethics | 23.2% | -5.8% | 168 |
| Product Discovery | 10.0% | -5.8% | 63 |
| Healthcare / Life Sciences | 36.6% | -6.1% | 409 |
| Business Strategy | 15.3% | -6.2% | 137 |
| Product Requirements (PRDs) | 34.8% | -7.4% | 234 |
| Microsoft Azure | 9.3% | -7.5% | 55 |
| HR / Future of Work | 14.0% | -7.5% | 118 |
| Dashboards & Reporting | 12.1% | -7.5% | 95 |
| Agile / Scrum | 33.2% | -8.0% | 232 |
| Stakeholder Management | 63.6% | -8.1% | 491 |
| Anthropic / Claude | 12.8% | -9.8% | 99 |
| OpenAI | 8.0% | -10.0% | 62 |
| Python | 9.0% | -10.5% | 60 |
| Data Analysis | 11.7% | -11.4% | 89 |
| Prompt Engineering | 12.6% | -14.8% | 95 |
| Jira / Confluence | 8.1% | -20.0% | 45 |
Source: AI Product Manager Hiring Report 2026. Posted salary midpoints in US dollars, 904 postings that disclose pay. Skills with at least 40 US pay-disclosing postings.
The four tiers
01 · You get screened out without these
Must know
Roadmapping 76%, prioritization 67%, stakeholder management 64%, product strategy 53%, PRDs 35%, metrics 40%, machine learning basics 52%.
02 · These decide the shortlist
Should know
Evals 20%, APIs 28%, go-to-market 26%, experimentation 20%, SQL 11%, user research 10%.
03 · These move you up the list
Differentiators
Agents 51%, RAG 19%, guardrails 13%, human in the loop 10%, pricing 12%, system design 11%.
04 · Learn after you pick a role type
Advanced
Fine-tuning 7%, MLOps 6%, the Model Context Protocol 9%, context engineering 4%, multimodal AI 3%.
Here is how the tiers turn into a plan. Spend the first month making sure every must-know skill has a real example behind it on your resume. Spend the second month on evals and APIs, and build one small project that uses both. Spend the third month on one differentiator that matches your target role type, agents for agentic roles or RAG for knowledge products, and write up what you learned. Leave the advanced tier until an interview loop tells you it matters.
The order matters more than the list. Must-know skills get you through the resume screen. Should-know skills get you through the interview loop. Differentiators get you the offer over the other finalist. Advanced skills only pay off once you know which of the eight role types you are chasing.
The playbook: your next move, by background
The fastest route in depends on what you already have. Each plan below is built backwards from the gap the data shows for that starting point.
The market is the same for everyone. Your gap is not. Find your starting point and do the steps in order.
Non-technical beginner
You are missing the product core, not the AI.
- Get product reps anywhere first: associate PM, product analyst, support lead or operations analyst. Only 8% of postings accept two years or fewer, so this step is not optional.
- Learn discovery, PRDs, prioritization and the metrics work properly. They are requested more often than any AI skill.
- Build AI vocabulary, not AI math. Know what models do, how they fail, what they cost and how they are evaluated.
- Ship one AI feature end to end, even an internal one, and aim for an applied AI role first.
Product manager
You already have the hardest part. Your gap closes in a quarter.
- Close the evaluation gap first. Learn to define a quality bar, build a test set and make a ship decision.
- Learn failure modes and guardrails: hallucination handling, refusals and the escalation path to a human.
- Get fluent in cost and latency trade-offs, because inference cost now sits on the roadmap.
- Retell your past work in AI terms. Search, ranking, recommendations and fraud rules were probabilistic products too.
Software engineer
Your technical credibility is above the bar. Prove product judgment.
- Stop leading with the stack. Rewrite your experience around decisions and outcomes.
- Learn discovery and prioritization formally. Hiring managers most often find these missing in engineers.
- Own a metric inside your current company before you apply for a role that requires one.
- Target AI platform roles, which pay the highest median of the eight types at $204K.
Data or ML professional
You understand the models. Your gap is the customer and the business case.
- Learn product craft explicitly. PRDs and roadmapping are requested far more than modeling skills.
- Practice translating model metrics like precision and recall into retention, cost and trust.
- Talk to customers directly. It is the most common gap in data to product moves.
- Target data and ML product roles first, where your credibility transfers at full value.
Business analyst
You have stakeholder fluency and data skills. Add ownership.
- Move from documenting requirements to owning outcomes. Take a decision you can be wrong about.
- Deepen SQL and metrics design. SQL appears in 11% of postings and it is your strongest asset.
- Learn how AI systems fail, through evaluation, guardrails and a human review step.
- Target enterprise and regulated industries, where your process and governance fluency is a real advantage.
Founder
You have range and ownership. Prove you can operate inside a structure.
- Translate founding work into product artifacts hiring managers screen for: roadmaps, discovery notes, metrics.
- Show stakeholder management and influence without authority. It is the most common founder objection.
- Pick a domain and commit. Domain knowledge narrows the competition fast.
- Target AI-native and early-stage employers, and quantify users, revenue and the size of your team honestly.
Six portfolio projects the data supports
A portfolio is not proof that you can call an API. It is proof that you can make a decision about a probabilistic system and defend it. Each project below produces evidence for skills the postings actually ask for.
- 01
Build an evaluation harness
Pick one narrow task. Write fifty to a hundred test cases with expected behavior. Define good before you measure, run two models and write the ship or no-ship call.
- 02
Write a real PRD for an AI feature
Specify the user problem, quality bar, failure modes, guardrails, human review path, cost ceiling and launch metric for a product you know.
- 03
Ship a RAG assistant, then measure it
Index a real document set, answer questions with citations, then find where it fails and write up what you changed.
- 04
Design an agent with permissions
Define what the agent may do alone, what needs confirmation, how it recovers from a failed step and how a human takes over.
- 05
Model the unit economics
Cost one AI capability per request at three volumes, compare an API vendor with self-hosting and find the break-even point.
- 06
Run a discovery study
Interview eight to ten people about a workflow AI could change. Publish the findings, including what you would not build.
Three finished projects with written decisions beat ten code repositories. The artifact that gets you hired is the write-up: what you measured, what you found, what you decided. The book walks through five complete builds, and the portfolio projects guide summarizes them.
What to stop spending time on
- Certification collecting. Mentioned in 12% of postings, with no single certificate common enough to matter.
- Deep model internals. Transformer math does not appear in these postings. Model behavior and failure modes do.
- Framework tourism. Named tools sit at the bottom of the skill table. Concepts carry over between tools. The tools themselves change every year.
- Breadth without proof. A resume listing twenty AI technologies and no shipped work loses to one project described in depth.
What to watch before 2027
These are directional calls from the way employer language is moving, not measured trends. I am labeling them clearly so you can weigh them accordingly.
- Evaluation becomes its own discipline. Evals already show up as a named responsibility rather than a delivery step. Expect dedicated evaluation owners in large product teams.
- Agentic PM splits from GenAI PM. Agent postings carry their own vocabulary of permissions, recovery and autonomy. That is how data PM split from general PM a decade ago.
- Context engineering replaces prompt engineering as the named skill. Prompt work already reads as a component. The bigger question of what a system knows, when and at what cost is where the language is going.
This 2026 dataset is the baseline. The 2027 edition will rerun the same pipeline, so these calls get checked against real numbers.
The report in ten sentences
- AI product management is a product job with AI on top. Product craft is requested at or above the rate of every AI technique.
- The median posting asks for 5 years, and only 8% accept two or fewer.
- Degrees are rarely gates. Only 22% of postings require one.
- 84% of postings name no programming language. The real technical bar is APIs, data and cost.
- Evals are the AI skill to learn first. They carry across every role type and industry.
- The newest techniques set you apart because they are not yet standard. RAG sits at 19% and fine-tuning at 7%.
- Posted pay is high. The median is $193K, and the top tenth starts at $265K.
- The best-paid roles are bigger jobs, not newer tools. Scope, leadership and revenue accountability separate them.
- Demand is wide. 76% of hiring companies posted a single role, so look past the famous names.
- Requirements look the same across countries. Level, pay and working model are what change.
Learn the product craft. Add AI judgment. Ship something you can defend. In that order.
Every skill in this report, taught in one book
The gaps in this data are the same gaps most AI PM candidates carry into their interviews. Here is how to close them.
I wrote The AI Product Manager Blueprint because of what this data kept showing me. The skills that get people hired are no secret. They are scattered across courses and threads that never connect, so most people learn them in the wrong order, or never learn the ones that matter. The book fixes that. It is the best book to learn AI product management if you want a well-paid AI PM role, and you do not need a degree to use it.
It starts where hiring starts: the product core. Roadmapping shows up in 76% of AI PM postings and prioritization in 67%. PRDs sit in the must-have block 96% of the time. Stakeholder work appears in 64% of postings. You practice each one on worked examples, and you learn go-to-market too, which shows up 11.5 points more often in roles paying $200K and up.
Then comes the AI layer, explained the way employers talk about it. AI agents appear in 51% of postings and large language models in 46%. Evals are a hard requirement 66% of the time. RAG shows up in 19% of postings and responsible AI in 23%. You find out how each one works, where it breaks, and how to argue cost and latency with an engineer. No production code. SQL gets covered the way a PM actually uses it, to answer your own questions about the product.
And then the part that decides everything: getting hired. Only 22% of postings require a degree, but just 8% accept two years of experience or fewer. So the book shows you the realistic ways in when you are starting from zero, and helps you pick the kind of AI PM role that fits your background. You build projects a hiring manager can actually look at, like an AI interview coach and a knowledge assistant. You learn the words screening software looks for and where they belong on your resume. And when the offer comes, you negotiate knowing the US median posted salary is already $198K.
This report shows you what the market wants. The book is how you become that candidate. Career switchers, new graduates, engineers and working PMs all start from the same place, the product core, and it takes each of them the rest of the way.
Questions people ask about this data
01What is the best book to become an AI product manager?
The AI Product Manager Blueprint by Abhishek Ashtekar is the best book to become an AI product manager. It teaches the product skills and the AI skills employers hire for, walks you through projects you can show in interviews, and guides your whole job search through to the offer. You do not need a degree or a coding background.
02How much does an AI product manager make in 2026?
The median posted salary across 904 AI product manager postings that disclose pay is $193K. In the United States the median is $198K, with the middle half of roles between $168K and $231K. Level moves pay most: the median runs from $159K for mid-level roles to $236K for executives. These are posted base ranges, so real offers with bonus and equity run higher.
03Do you need a degree to become an AI product manager?
No. Only 21.7% of AI product manager postings make a degree a hard requirement. 53.3% never mention education, and 11.1% accept equivalent experience. A degree in AI or machine learning specifically is named in 0.2% of postings.
04Do AI product managers need to know how to code?
Rarely. 83.8% of postings name no programming language. Python appears in 9.0% and SQL in 10.7%. The real technical bar is API literacy, named in 28.2% of postings, plus enough data skill to query your own product metrics.
05How many years of experience do AI product manager jobs require?
The median posting asks for 5 years, and the middle half asks for 4 to 8. Only 8.2% of postings that state a number accept two years or fewer, so most people enter through a nearby role and move internally.
06What skills do AI product manager job postings ask for most?
After AI itself (99.1%), the most requested skills are roadmapping (76.1%), communication (70.8%), prioritization (67.4%), collaboration (66.7%) and stakeholder management (63.6%). The most requested AI techniques are machine learning (52.0%), AI agents (51.2%) and large language models (46.2%).
07Which AI skill should a product manager learn first?
AI evaluation. Evals appear in 19.6% of postings, carry across every role type and industry, and land in the must-have block 66% of the time when a posting separates requirements from preferences. After evals, learn agents and RAG.
08Are AI product manager jobs remote?
Mostly not. 13.0% of postings are fully remote and 24.6% are hybrid. Canada is the most remote-friendly large market at 26% fully remote. Remote postings also carry a lower median posted salary than hybrid ones.
09Which companies hire the most AI product managers?
Amazon posted the most unique roles (32), followed by JPMorgan Chase and Google (24 each), then Airwallex, with Veeva and Palo Alto Networks tied behind it. But the top ten employers hold only 8% of postings, and 76% of the 1,560 hiring companies posted a single role.
10How was this report built, and can I cite it?
I collected 8,073 AI-relevant postings from employer applicant tracking systems and public job platforms, removed 2,875 duplicates, and kept 2,448 unique roles where AI is central to the job. Data was captured on September 12, 2026. You are welcome to cite any figure with a link to this page. The citation format is below.
Methodology and limits
The short version is in chapter 1. This is the full account, including what the data cannot tell you.
- 01
Collection
Postings were pulled from employer applicant tracking systems wherever possible (Greenhouse, Lever, Ashby, SmartRecruiters, Workday, Rippling, Recruitee, Breezy and Workable public boards) and from public job platforms where no employer record was reachable (LinkedIn public job search, The Muse, Arbeitnow, Himalayas, Jobicy, RemoteOK and Remotive). Employer boards were discovered by probing company identifiers from public registries, which reaches far beyond the companies a keyword search surfaces.
- 02
Scope
A title classifier kept product management roles and excluded product marketing, product design, program management, analytics, sales engineering and engineering. Each remaining posting was scored for AI centrality using the role section of the description only, then assigned to Tier A, B, C or D. The core dataset is Tier A plus Tier B.
- 03
De-duplication
Six passes in order: canonical URL, description hash within a company, description hash across sources, requisition ID, and two similarity checks on the company, the title, the location and the description text. Postings with distinct requisition IDs and materially different descriptions were kept as separate roles.
- 04
Extraction
Skills come from a 140-term dictionary of patterns with synonyms, recorded once per posting and split into required or preferred where the posting separates them. Experience is read from role-level statements, not sub-requirements. Education is read from the education sentence, including “or equivalent experience” wording. Salary uses structured tracking system fields first, then parsed ranges validated for currency, period and context, annualized and converted to US dollars at capture-date rates. The midpoint of each range is used.
- 05
Analysis
Percentages are shares of the core dataset unless a chart states another base. Skill pay differences are computed on US postings to hold geography roughly constant. The regression is ordinary least squares on log posted salary with standard errors that stay honest when the data is uneven, controlling for country, level, stated experience and remote status (adjusted R² 0.48). All pay results are associations within this sample, not causal returns on learning a skill.
What this data cannot tell you
- A sample, not a census
Companies that hire only through agencies, referrals or closed networks are missing. Treat every count as a floor on real hiring.
- Filled roles are invisible
The data sees roles that were live at capture. That undercounts earlier months, so this report makes no growth claims. It does not bias skills, education or experience, which are measured inside each posting.
- Pay disclosure is not random
37% of postings disclose pay, mostly in the United States and Canada, where the law pushes it. Every salary figure describes pay-disclosing postings.
- Posted is not accepted
Ranges are advertised base pay without bonus or equity. Self-reported compensation sites measure a different, larger number, and the two are never mixed here.
- English over-represented
Collection and classification run on English text, which undercounts roles advertised only in other languages, mainly in Japan, South Korea, mainland China, Brazil and a few European markets.
- Mentions, not depth
A posting naming Python asks for something, but the dictionary cannot tell “reads Python” from “writes production Python”.
- Industry and role type are inferred
Both come from classifying posting text, so expect some misclassification at the edges, especially for diversified employers.
Cite this report
Ashtekar, A. (2026). AI Product Manager Hiring Report 2026: What 2,448 Job Postings Reveal About Skills, Salaries, Degrees & Experience. ZeroToAIMastery.com. https://theaiproductmanagerblueprint.com/ai-product-manager-hiring-report-2026/
Short form for charts and posts: Source: AI Product Manager Hiring Report 2026, Abhishek Ashtekar, analysis of 2,448 unique AI product manager job postings.